There’s a specific way I’d like to evaluate students and later be able to visualise a class’ evaluation over time.

The evaluation is on the scale of 1-4.
Is there a way to do this in gibbon? Maybe using rubrics and marksheets?
There’s a specific way I’d like to evaluate students and later be able to visualise a class’ evaluation over time.
The evaluation is on the scale of 1-4.
Is there a way to do this in gibbon? Maybe using rubrics and marksheets?
Hi karthik0210, and welcome to the Gibbon community. Gibbon certainly can mark on a scale of 1-4, which you can add to the system under Admin > School Admin > Manage Grade Scales. This can then be used under Assess > Markbook to get the data columns you are looking for. The Markbook can do cumulative assessment, per term and for the whole year. It can also support rubrics, with some nice visualisations if you’d like.
If you want to do fancier calculations, you can use some custom code to pull Markbook data into the Reports module, and format it there for export to PDF.
I hope this helps!
Ross
Hi Ross! Thanks a lot for the response.
I was able to create a grade scale. But I’m not sure how Rubrics work, and what the rows and columns are.
I tried placing the parameters as rows, and the marks (1, 2, 3, 4) as columns. How do I use the rubric? I am able to select multiple columns per row. And when I select the visualize option from the dropdown, after marking, I see an empty chart.
Thanks,
Karthik
Hi Karthik,
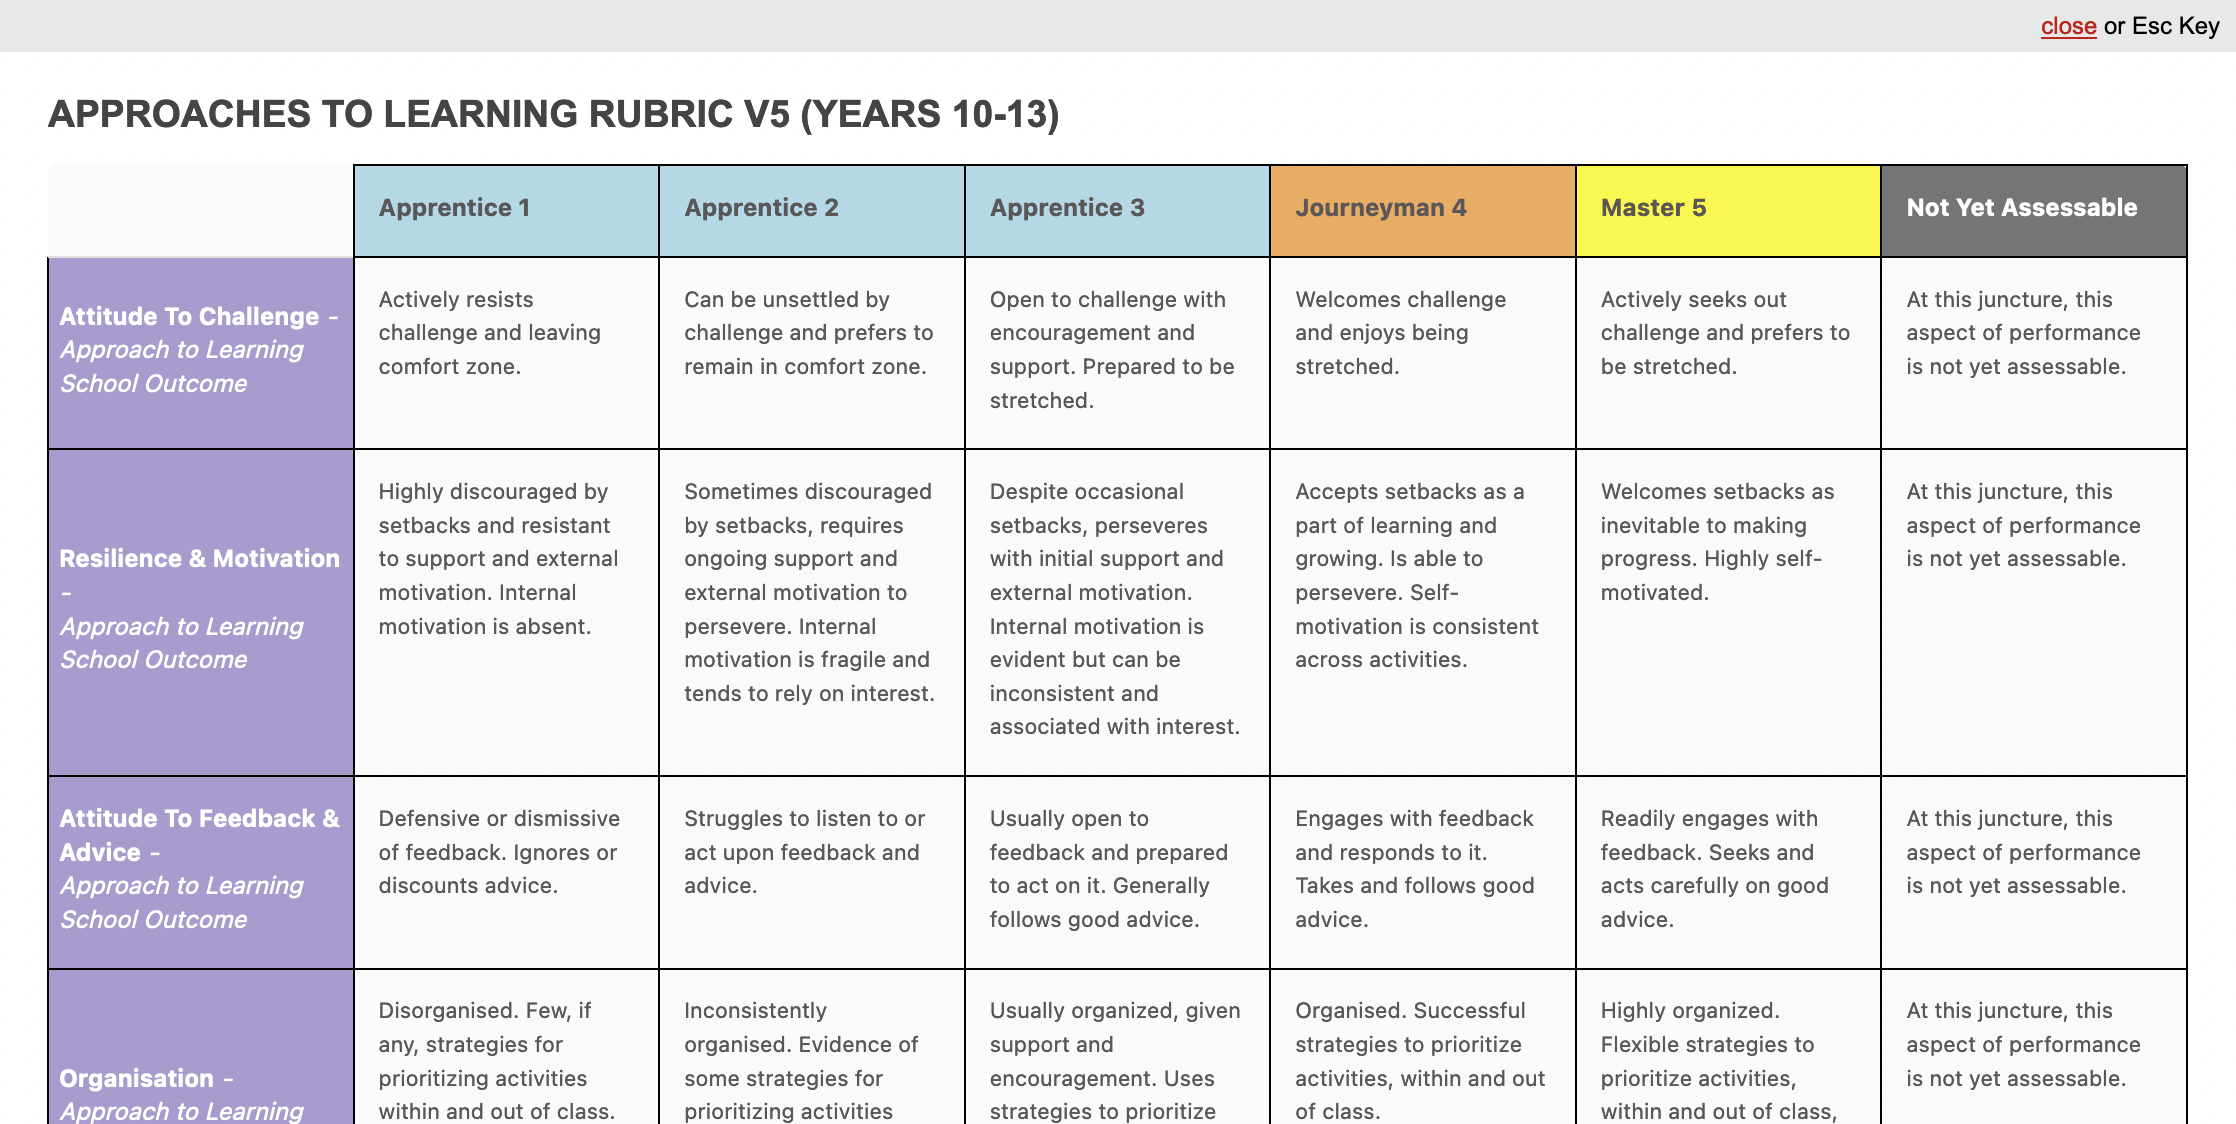
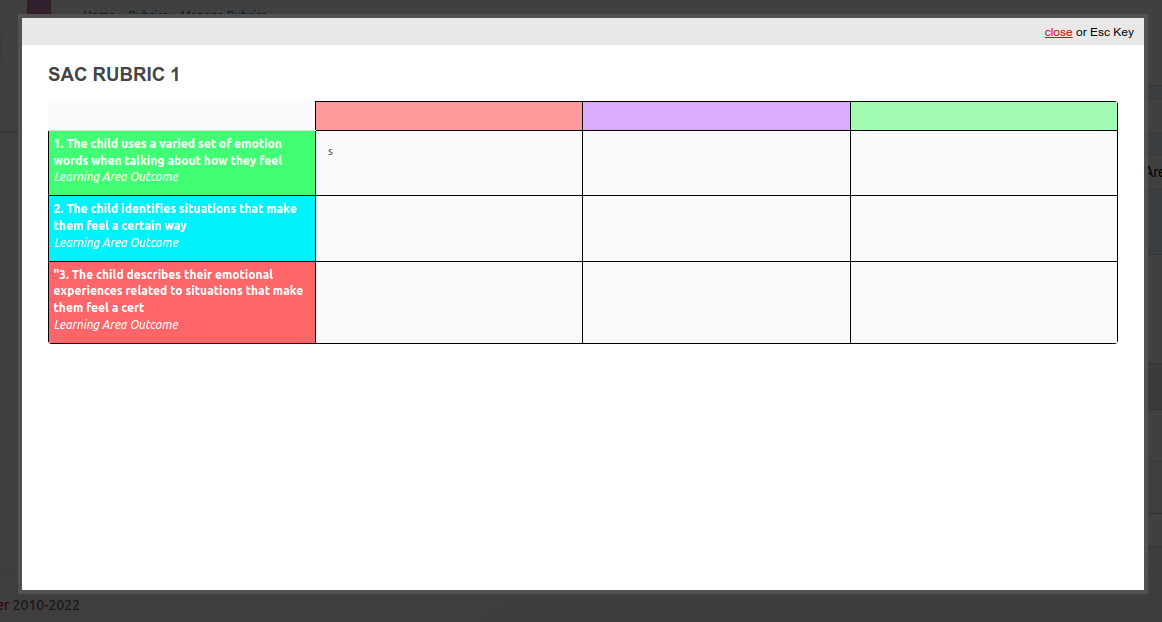
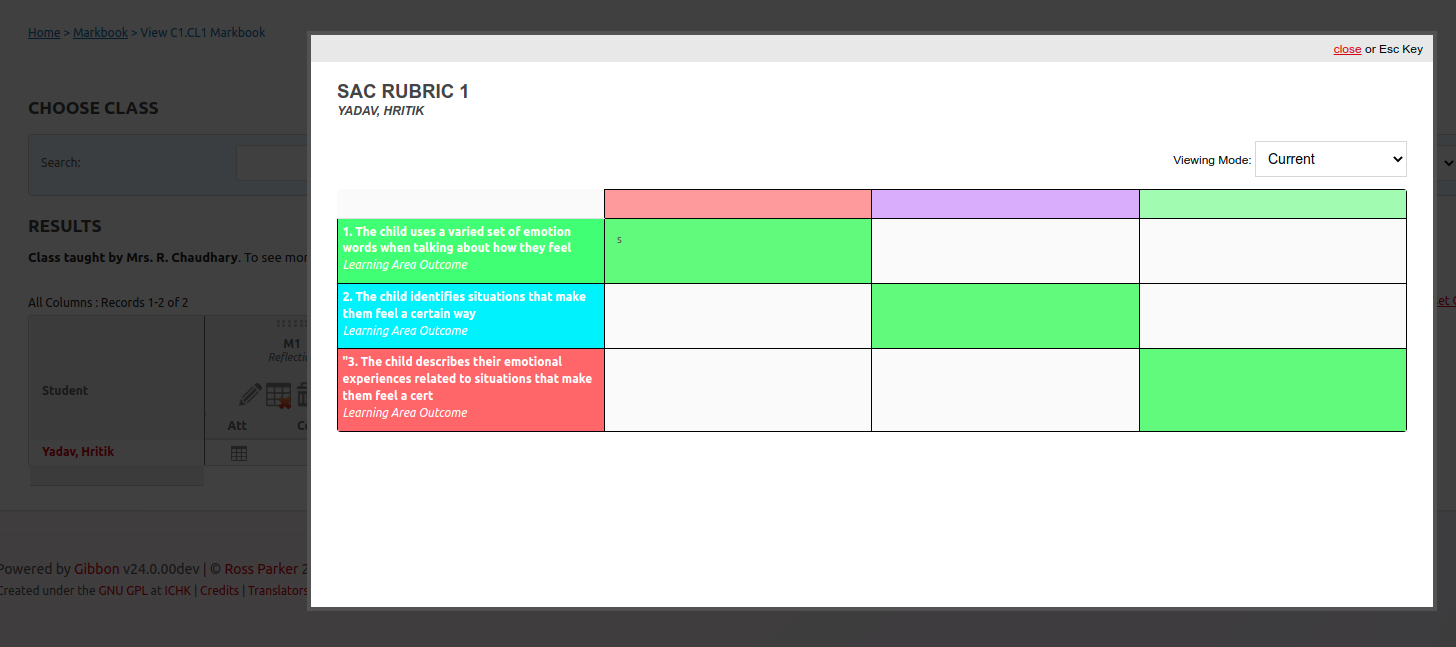
Usually in a rubric, the scale goes in the column headers, and the outcomes go in the first cell of each row, like this:
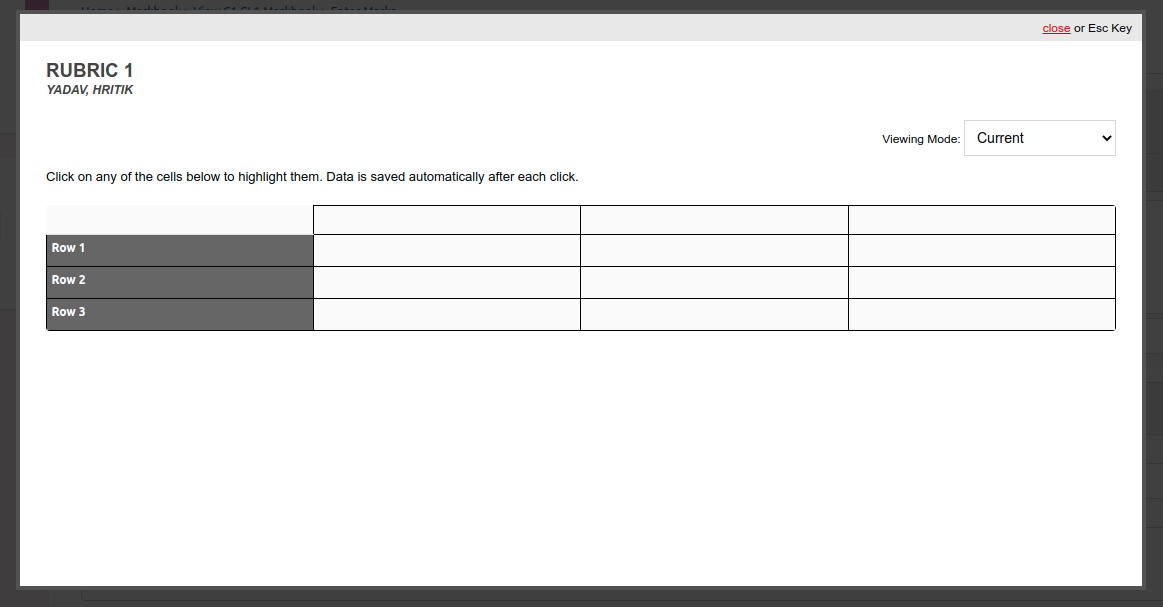
When using a rubric, such as in the Markbook, you can then click on cells to select them: they turn green, and there is no need to save.
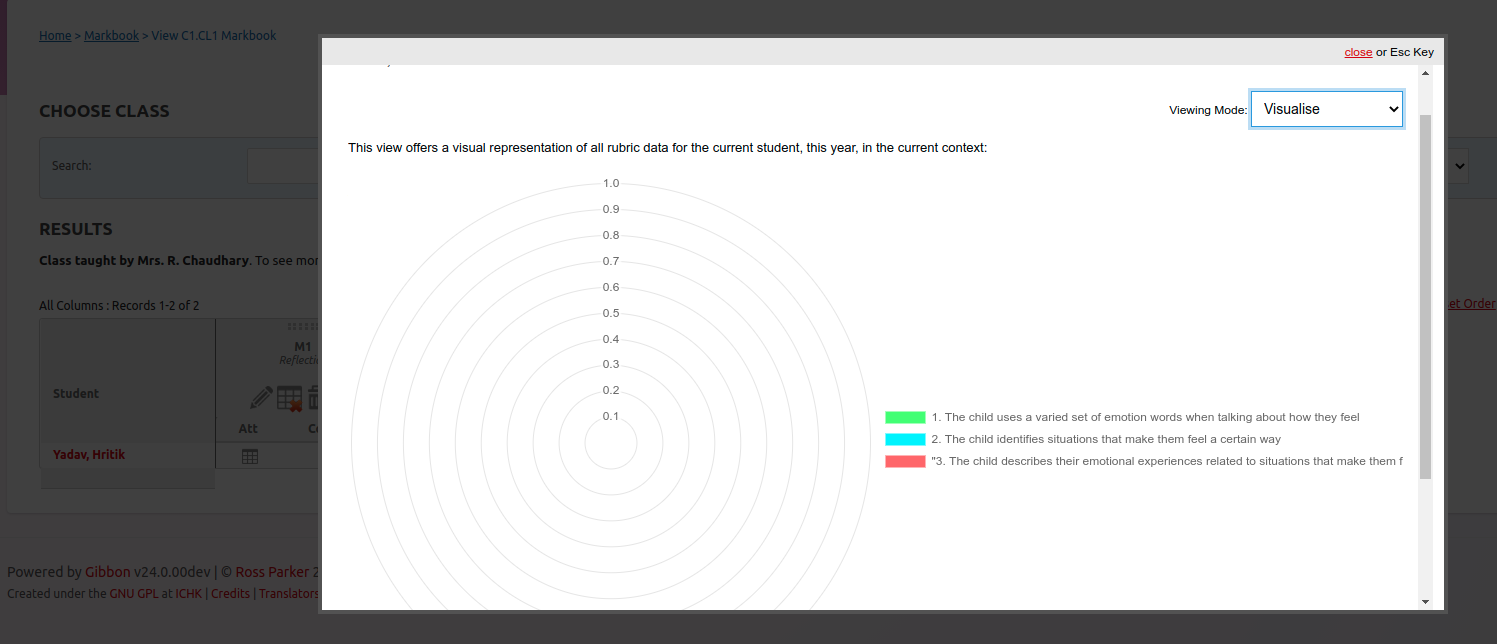
Once there is some data in a rubric you can go to Visualise, but if you’ve just entered the data, you’ll want to close the rubric and reopen it. The best part about Visualise is that it combines all the rubric data from all teachers for that student in that context (e.g. Markbook), and so gives a visual overview of overall performance.
Cheers,
Ross
The rubric feature doesn’t look stable. At times, I am not able to click on the cells. At times, the text in the column headers is blank, even when values have been defined in the rubric design.

I just randomly edited the markbook, till I could click on the cells and they responded, made two entries, chose the visualize option, but the chart is empty.

Any ideas what the issue could be? Am I doing something wrong?
Thanks,
Karthik
Hi Karthik,
I am sorry to hear that you are having problems here. Rubrics have been part of Gibbon for a long time, since around v6 I believe. As such, they should be mature and reliable, which is definitely my experience of using them.
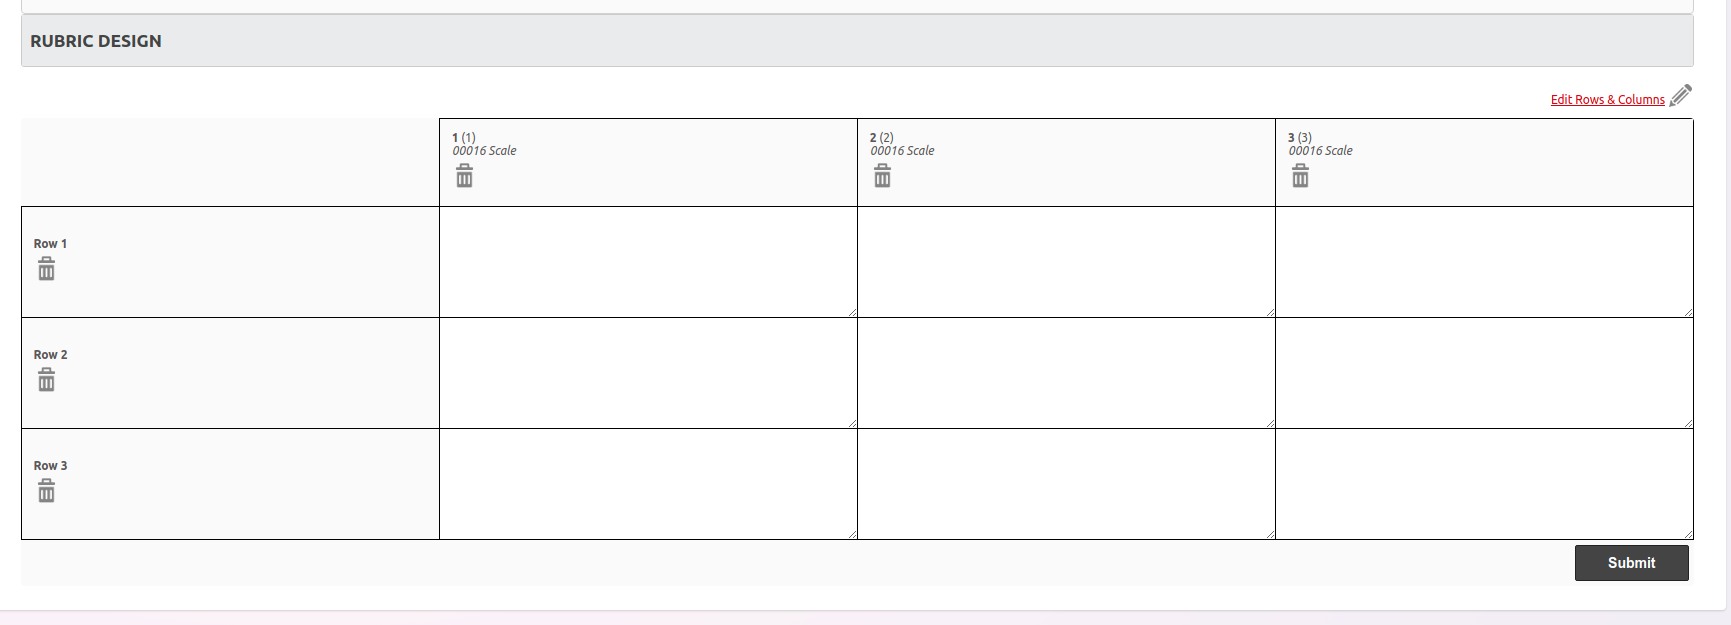
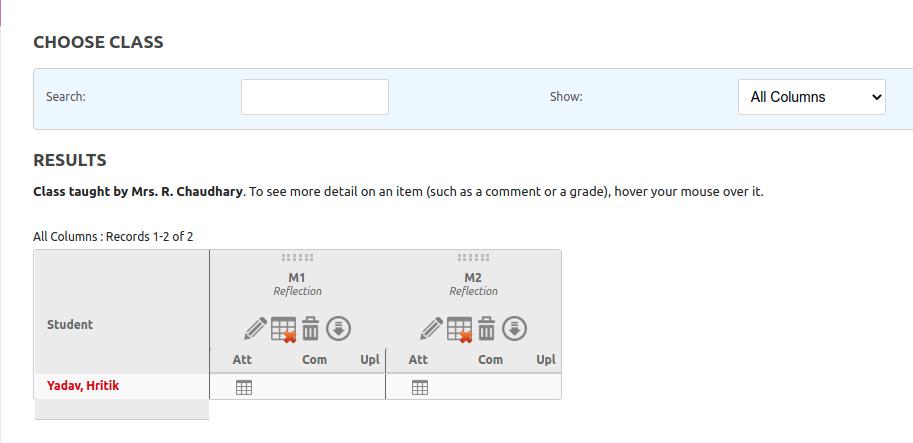
Please note that in the view below, you need to click on the data entry icon in the Markbook column header (shown with the red arrow below) in order to enter data:
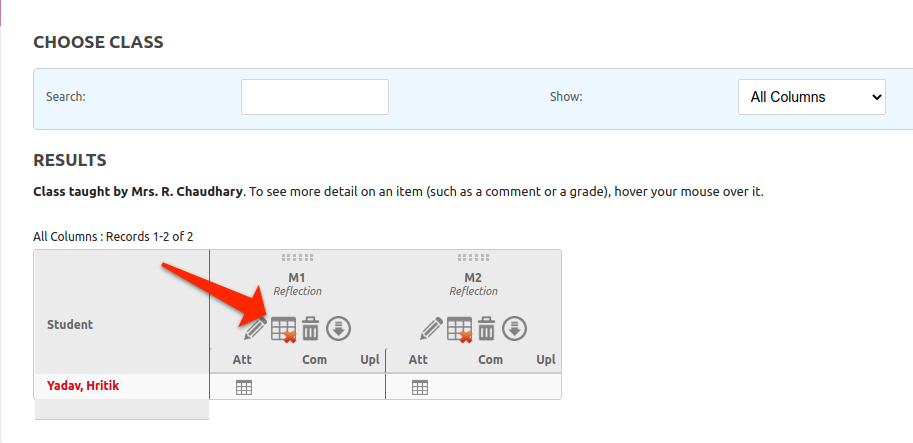
If you are clicking into the smaller rubric icon against the students name in this view, you’ll see a read-only version of the rubric, and not be able to select any cells.
Let us know if this helps to resolve your problem.
Cheers,
Ross