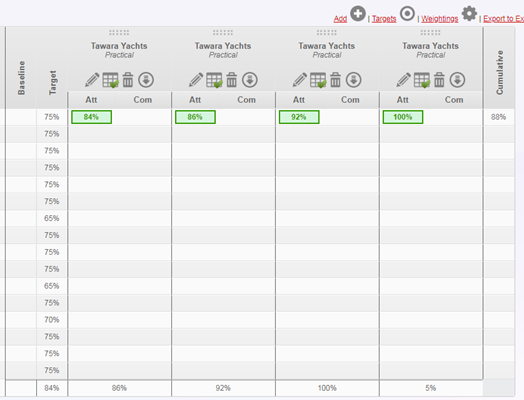
Could you please tell me why the column average is shifted one cell to the left, and why there is a value of 5% instead of the cumulative value average?
Practical weighting is set at 50%
Each column is adjusted for attainment weight:
WP (32 - 1), DB (28 - 0.88), MM (12 - 0.38) and PPT (0.25).
32, 28, 12 and 8 are raw grades for tasks on a CIE exam paper. I like to see how well students perform for each task and get them to target tasks where there are deficiencies.
Hmm, this does seem odd. I wonder if it’s a combination of using target & baseline together, which may have been a use-case I didn’t consider when adding the cumulative per-column average I’ll check it out and see if there’s a quick fix.
If you’re up to the task of editing files, you could apply the same fix to v16 by changing the highlighted lines in the PR (there’s not many). Otherwise, the fix will be included in the next release of Gibbon on January 20, 2019.
I think you prognosis is correct. I had target %s to see if students were hitting the ‘A’ threshold for raw grades and the cumulative average, and trying to use internal assessment - something which I still have to get my head around - as a baseline measurement for the final CIE grade.