I’ve been spending some time exploring what’s possible with the Reports module, and wanted to share an example. A school recently approached me about building a custom report card, so I put this together for them inside Gibbon. I’ve replaced most of the original names and wording, but the structure and logic are the same.
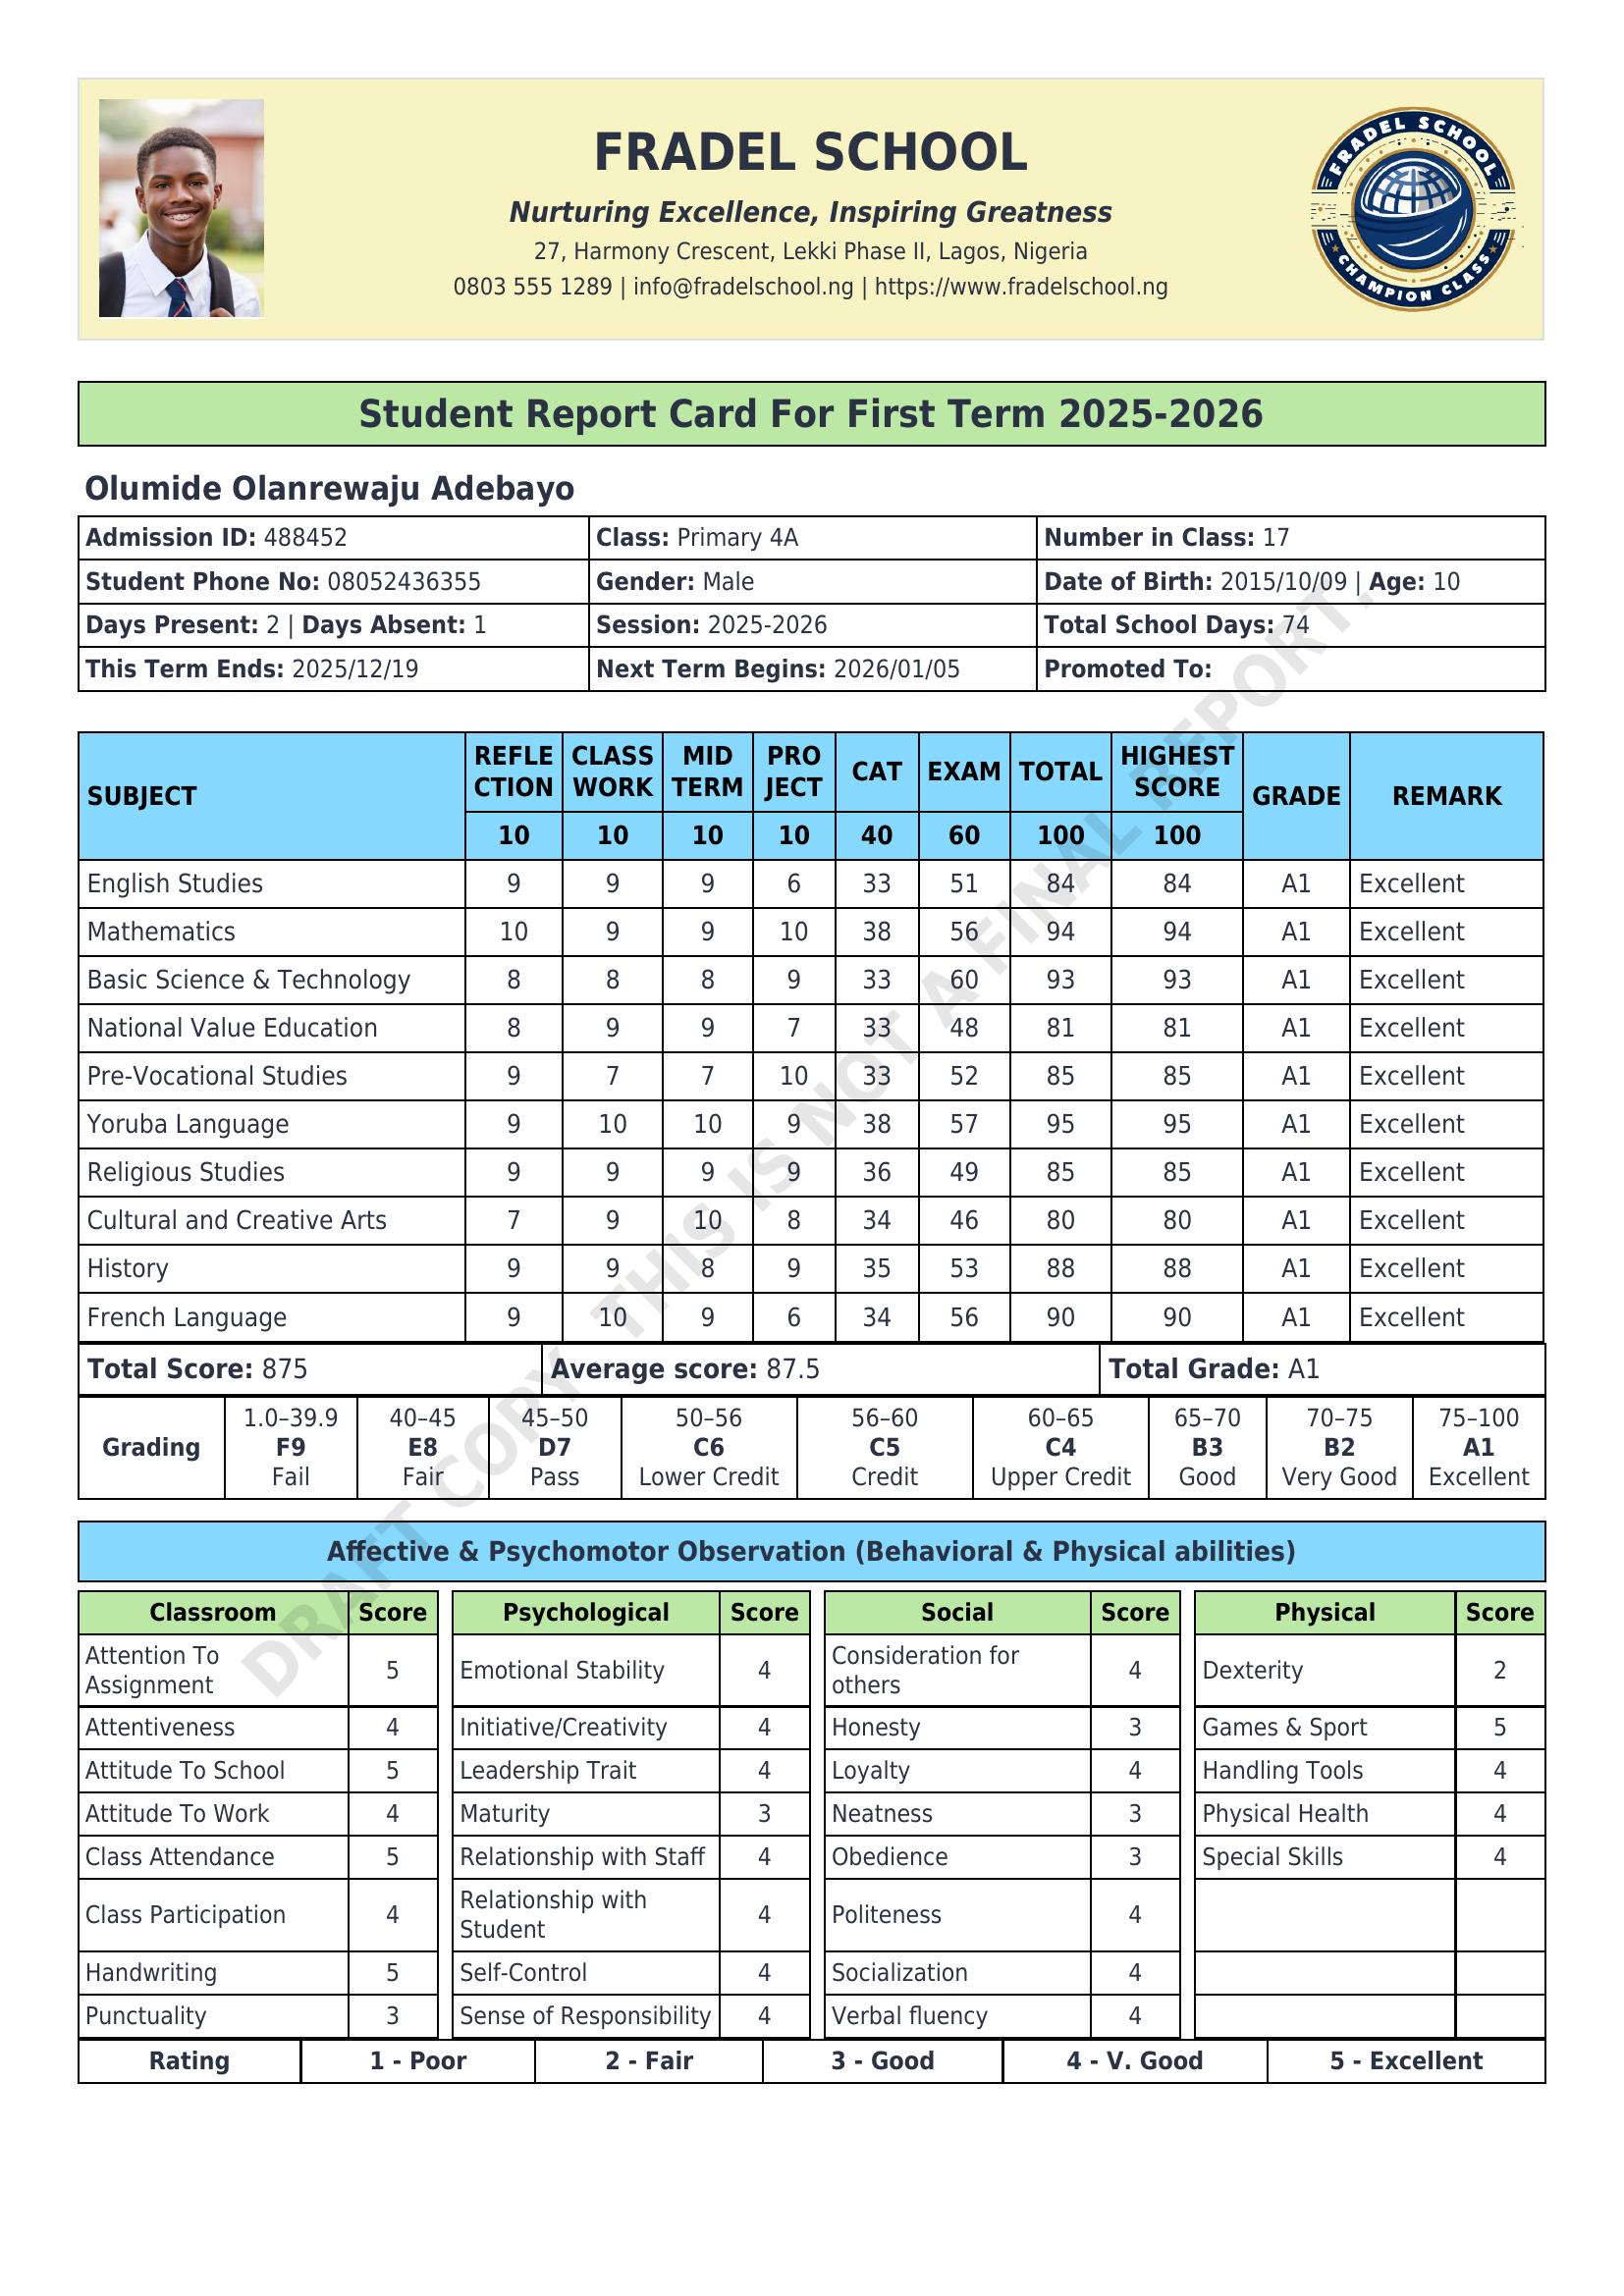
This report consolidates data from various Gibbon areas, including Markbook, Attendance, User Admin, Students, Staff, School Admin, and Form Groups, into a single layout. Once the data is entered and the template is set up, generating reports becomes a quick, straightforward process, even for an entire school.
I’m still learning and experimenting, and I’d really love to hear how others in the community are using the Reports module. If you’ve built anything interesting or found creative ways to combine data, I’d be keen to see it.
Hi Tieku, thanks for sharing! I like the addition of a chart, is that something you’re generating automatically or adding manually as a picture?
When working with markbook data, are you using a script or process to move the marks across into the reporting module, or are teachers entering this data manually? I have had requests in the past for a way to move markbook data into report criteria values. It hasn’t been a priority for my school, so it’s been low on the feature list, but I wondered if this was something that would benefit the schools you’re working with.
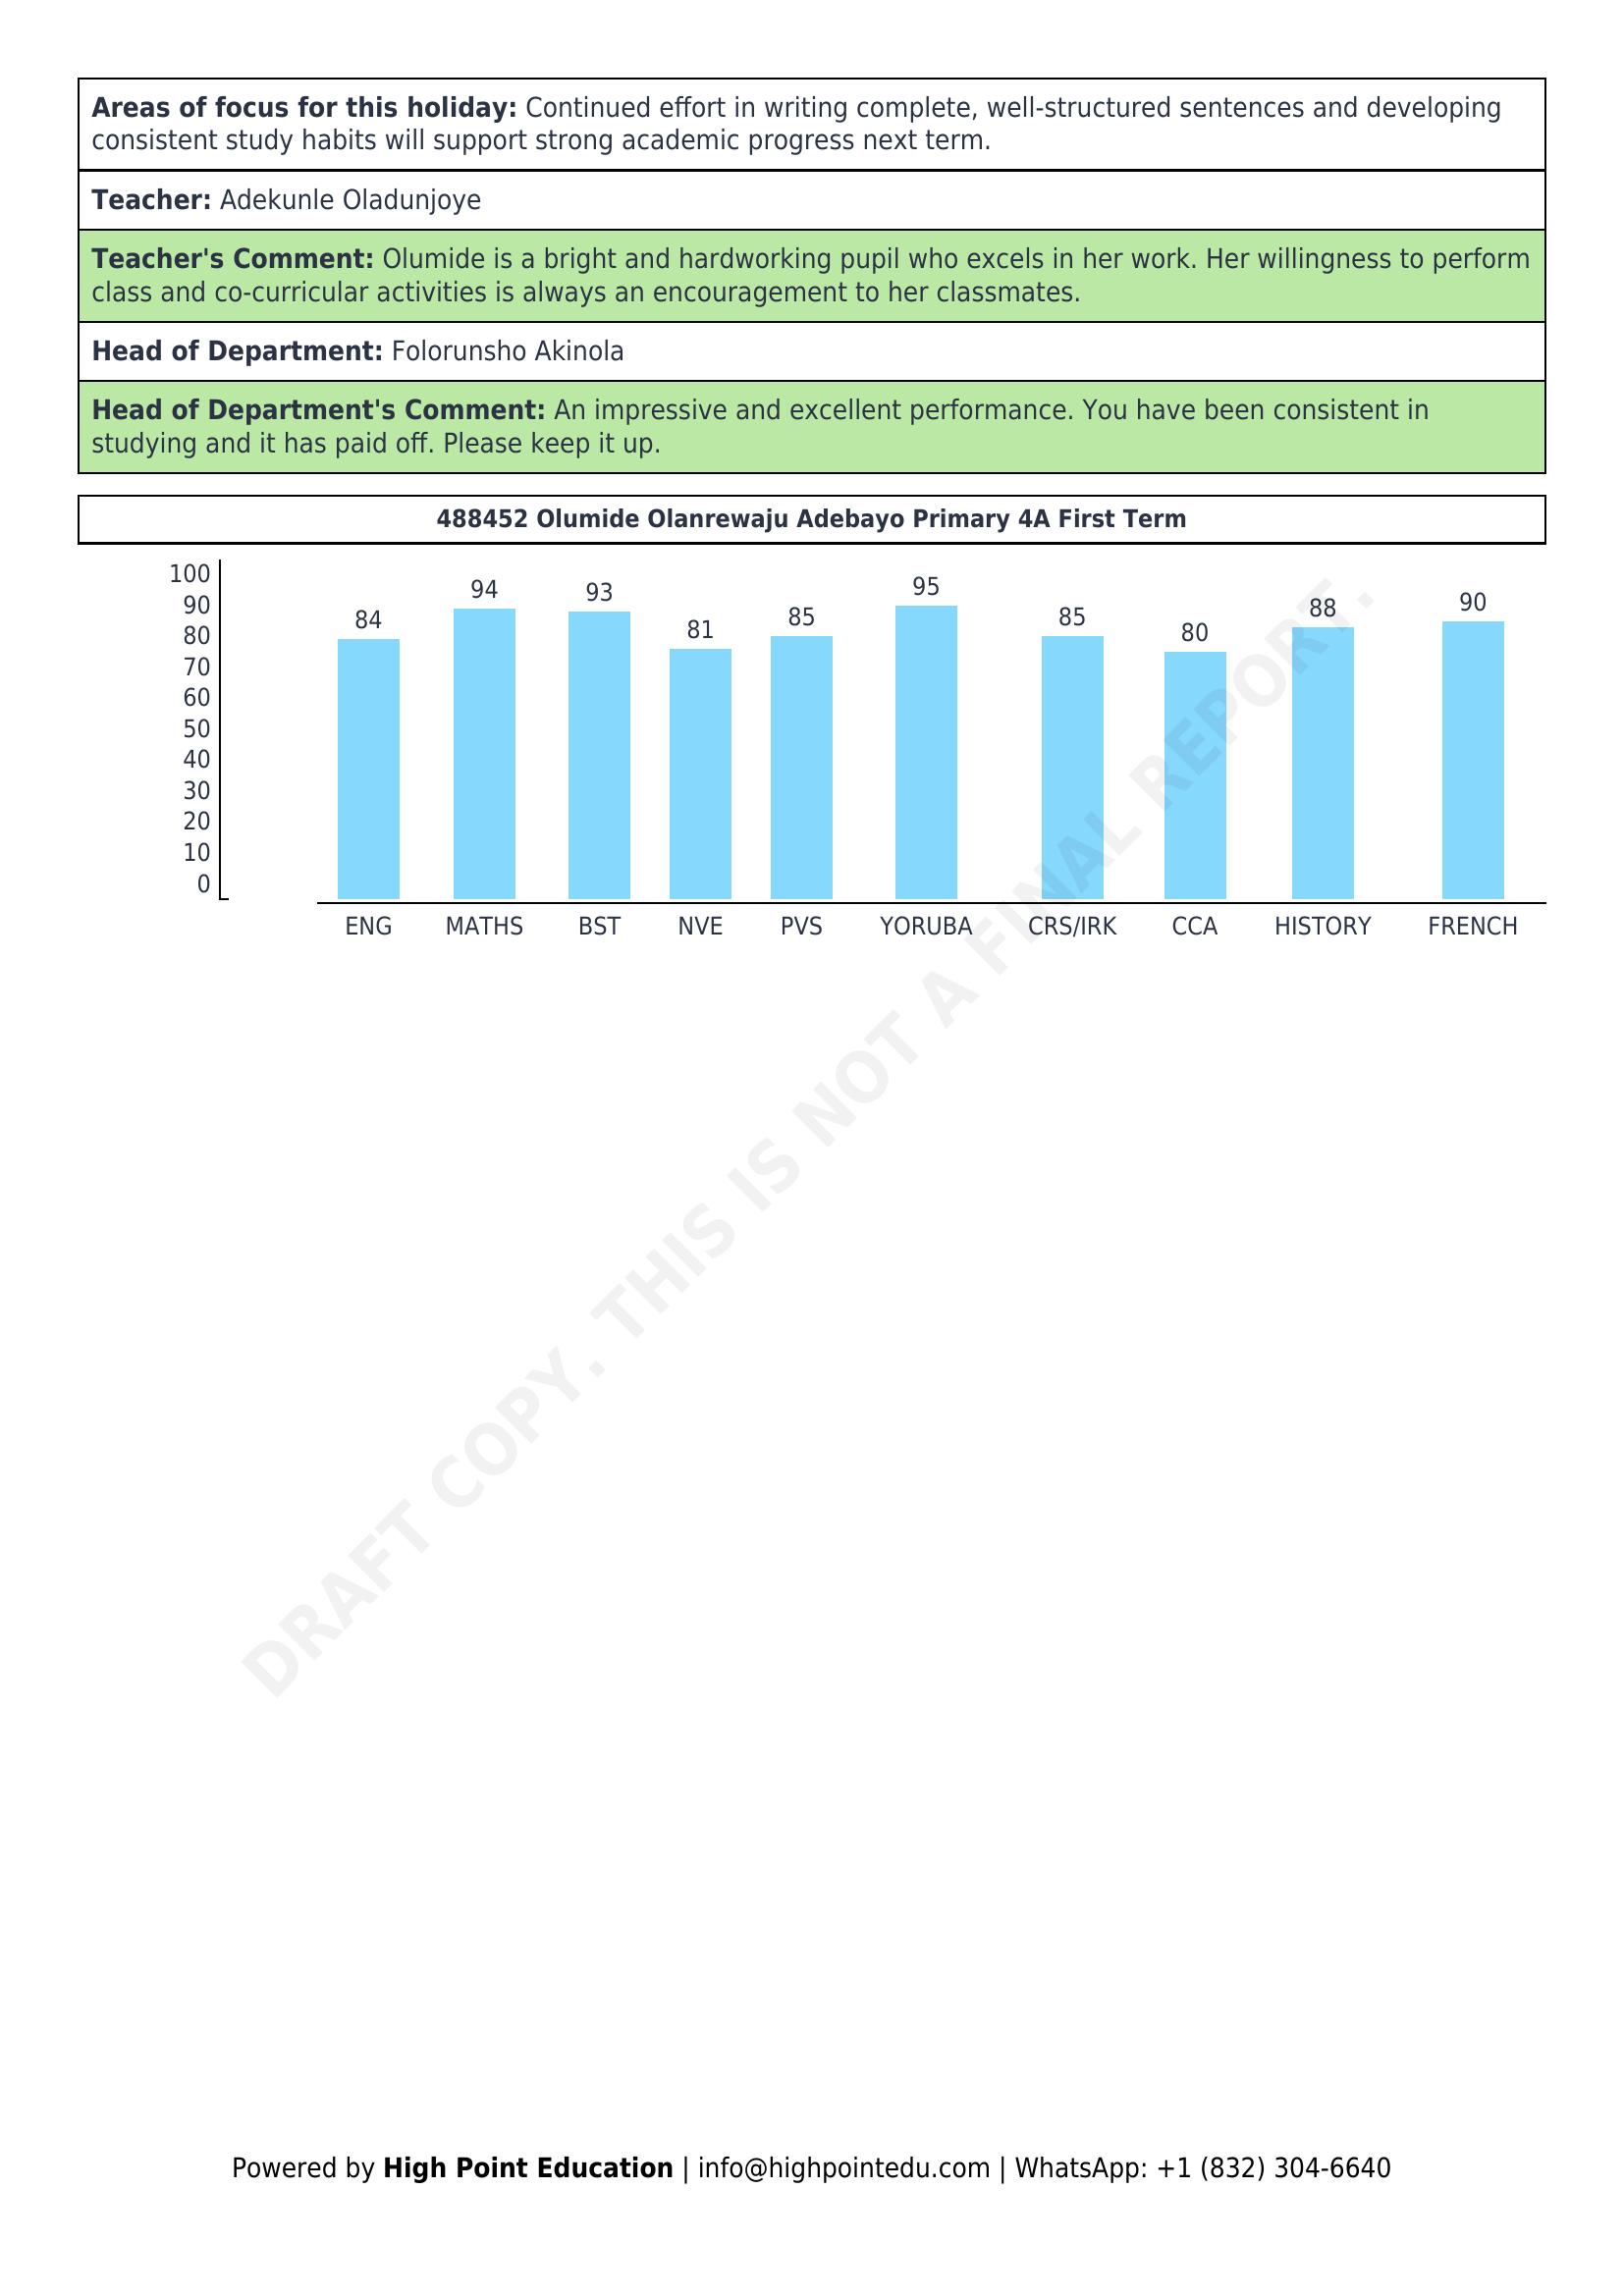
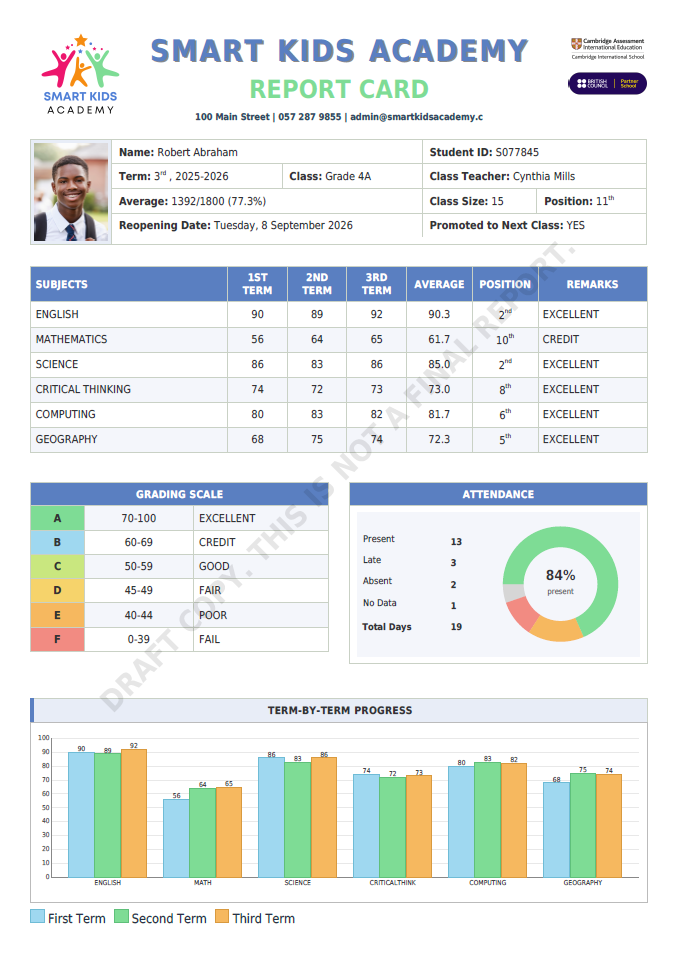
Chart:
The chart is generated automatically, not added as a static image. It’s all done in the report template using Twig + plain HTML tables/CSS, so it works nicely with mPDF. For each subject I re-use the same logic as the markbook table to calculate the CAT + Exam total out of 100, then convert that value into a bar height (in mm). The “bars” are just table cells with a background colour and variable height, with the score printed above and the subject label below. So once the markbook data is there, the chart builds itself for every student and every run of the report.
Markbook, reporting:
For this report I’m not asking teachers to re-enter anything into the Reports module. I created a custom report data source (Markbook.php) that pulls directly from the markbook tables for the chosen student/term/class. The numeric fields (Reflection, Classwork, Midterm, Project, Exam, etc.) all come straight from markbook, and the Twig template does the aggregation (CAT, Total, grade, average, etc.) on the fly.
Teachers only type the narrative bits (holiday focus, teacher comment, HoD comment) once, in fields that are also fed in via the same data source. So there’s no separate script to “push” data into report criteria values at the moment – it’s more of a live read from markbook whenever the report is generated.
That said, I can definitely see a use-case for a core feature that can move/snapshot markbook data into report criteria, especially for schools that want to lock values at a certain date, or do more complex workflows inside the Reports UI. The schools I’m working with are happy with this direct-from-markbook approach right now, but I’d be very interested in anything in that direction and would gladly test it.
Ross actually got me started a few years ago when he sent me a starter Reports module.
The process of generating custom report cards in Gibbon—using grades and comments from the Markbook—is what I’ve tried to outline above. The example I shared is just one possible setup.
If you have a specific type of student report you’re trying to generate, feel free to share it here (or describe the layout and requirements). I’d be happy to walk you through the steps in a more tailored way.
I’ve been working on getting my reports live for about a month off and on, and I’ve had an absolute breakthrough. It’s not beautified, but the hard work of getting custom data to loop correctly per course in twig has me over the moon. No good deed goes unpunished—now that I have proof of concept I’ve got to get to work on transcripts across years.
As @tiekubd has shown, reports are tremendously powerful once you work out the source logic.
Hi Sanders, it is amazing to see how far you’ve come in just a couple of months, as you work towards your report release date. Good luck bringing your transcripts together!
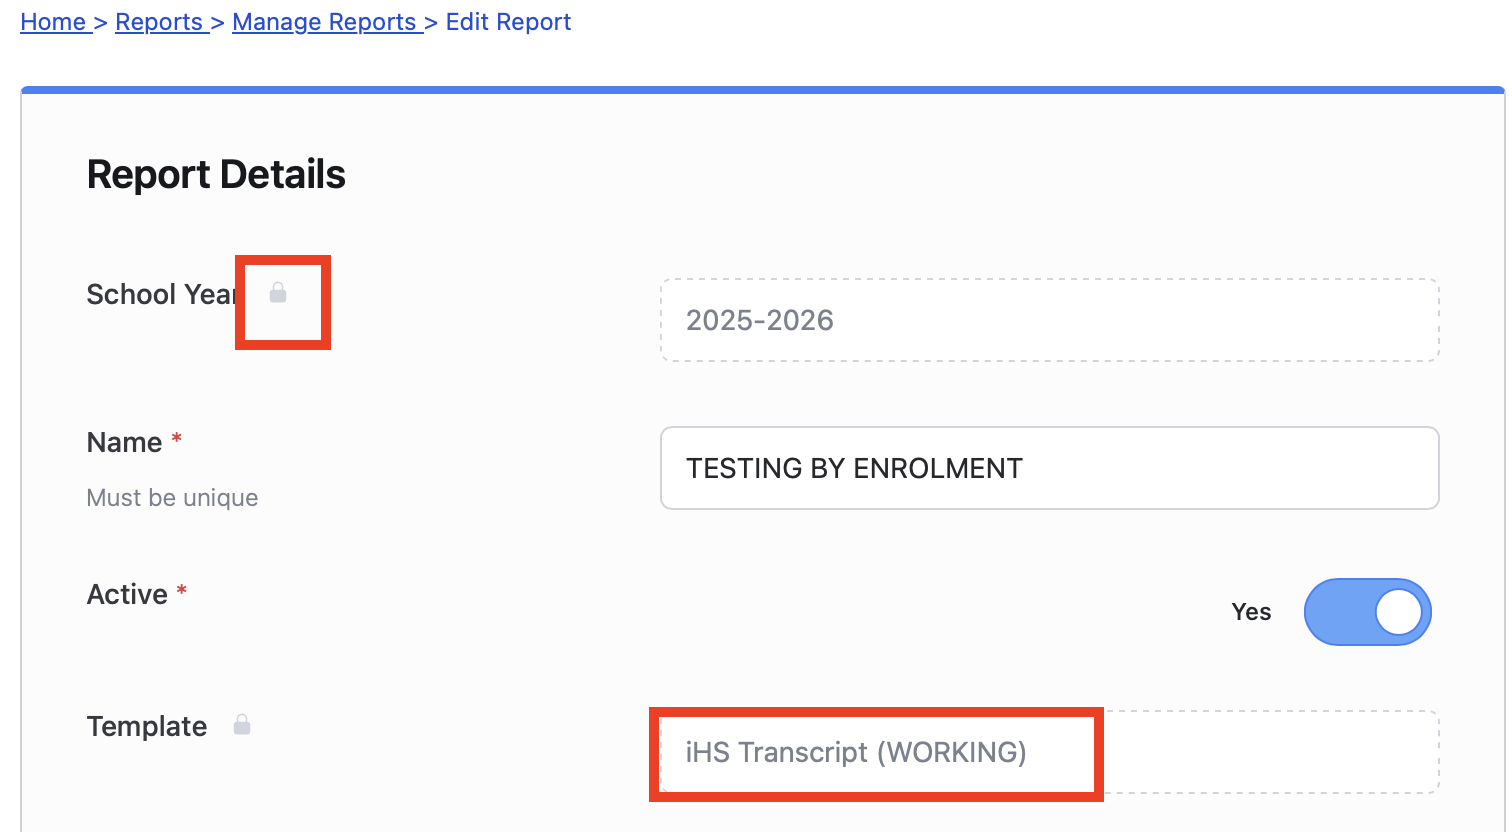
I’ve started working on transcripts now, and I’ve been parsing most of the logic through custom datasources. Because of this, I don’t rely on any data generated via reporting cycles. Is it possible to generate reports outside of reporting cycles? It seems inefficient to rebuild the report template and access permissions every year when the logic doesn’t depend on cycles, but perhaps I’m missing something critical.
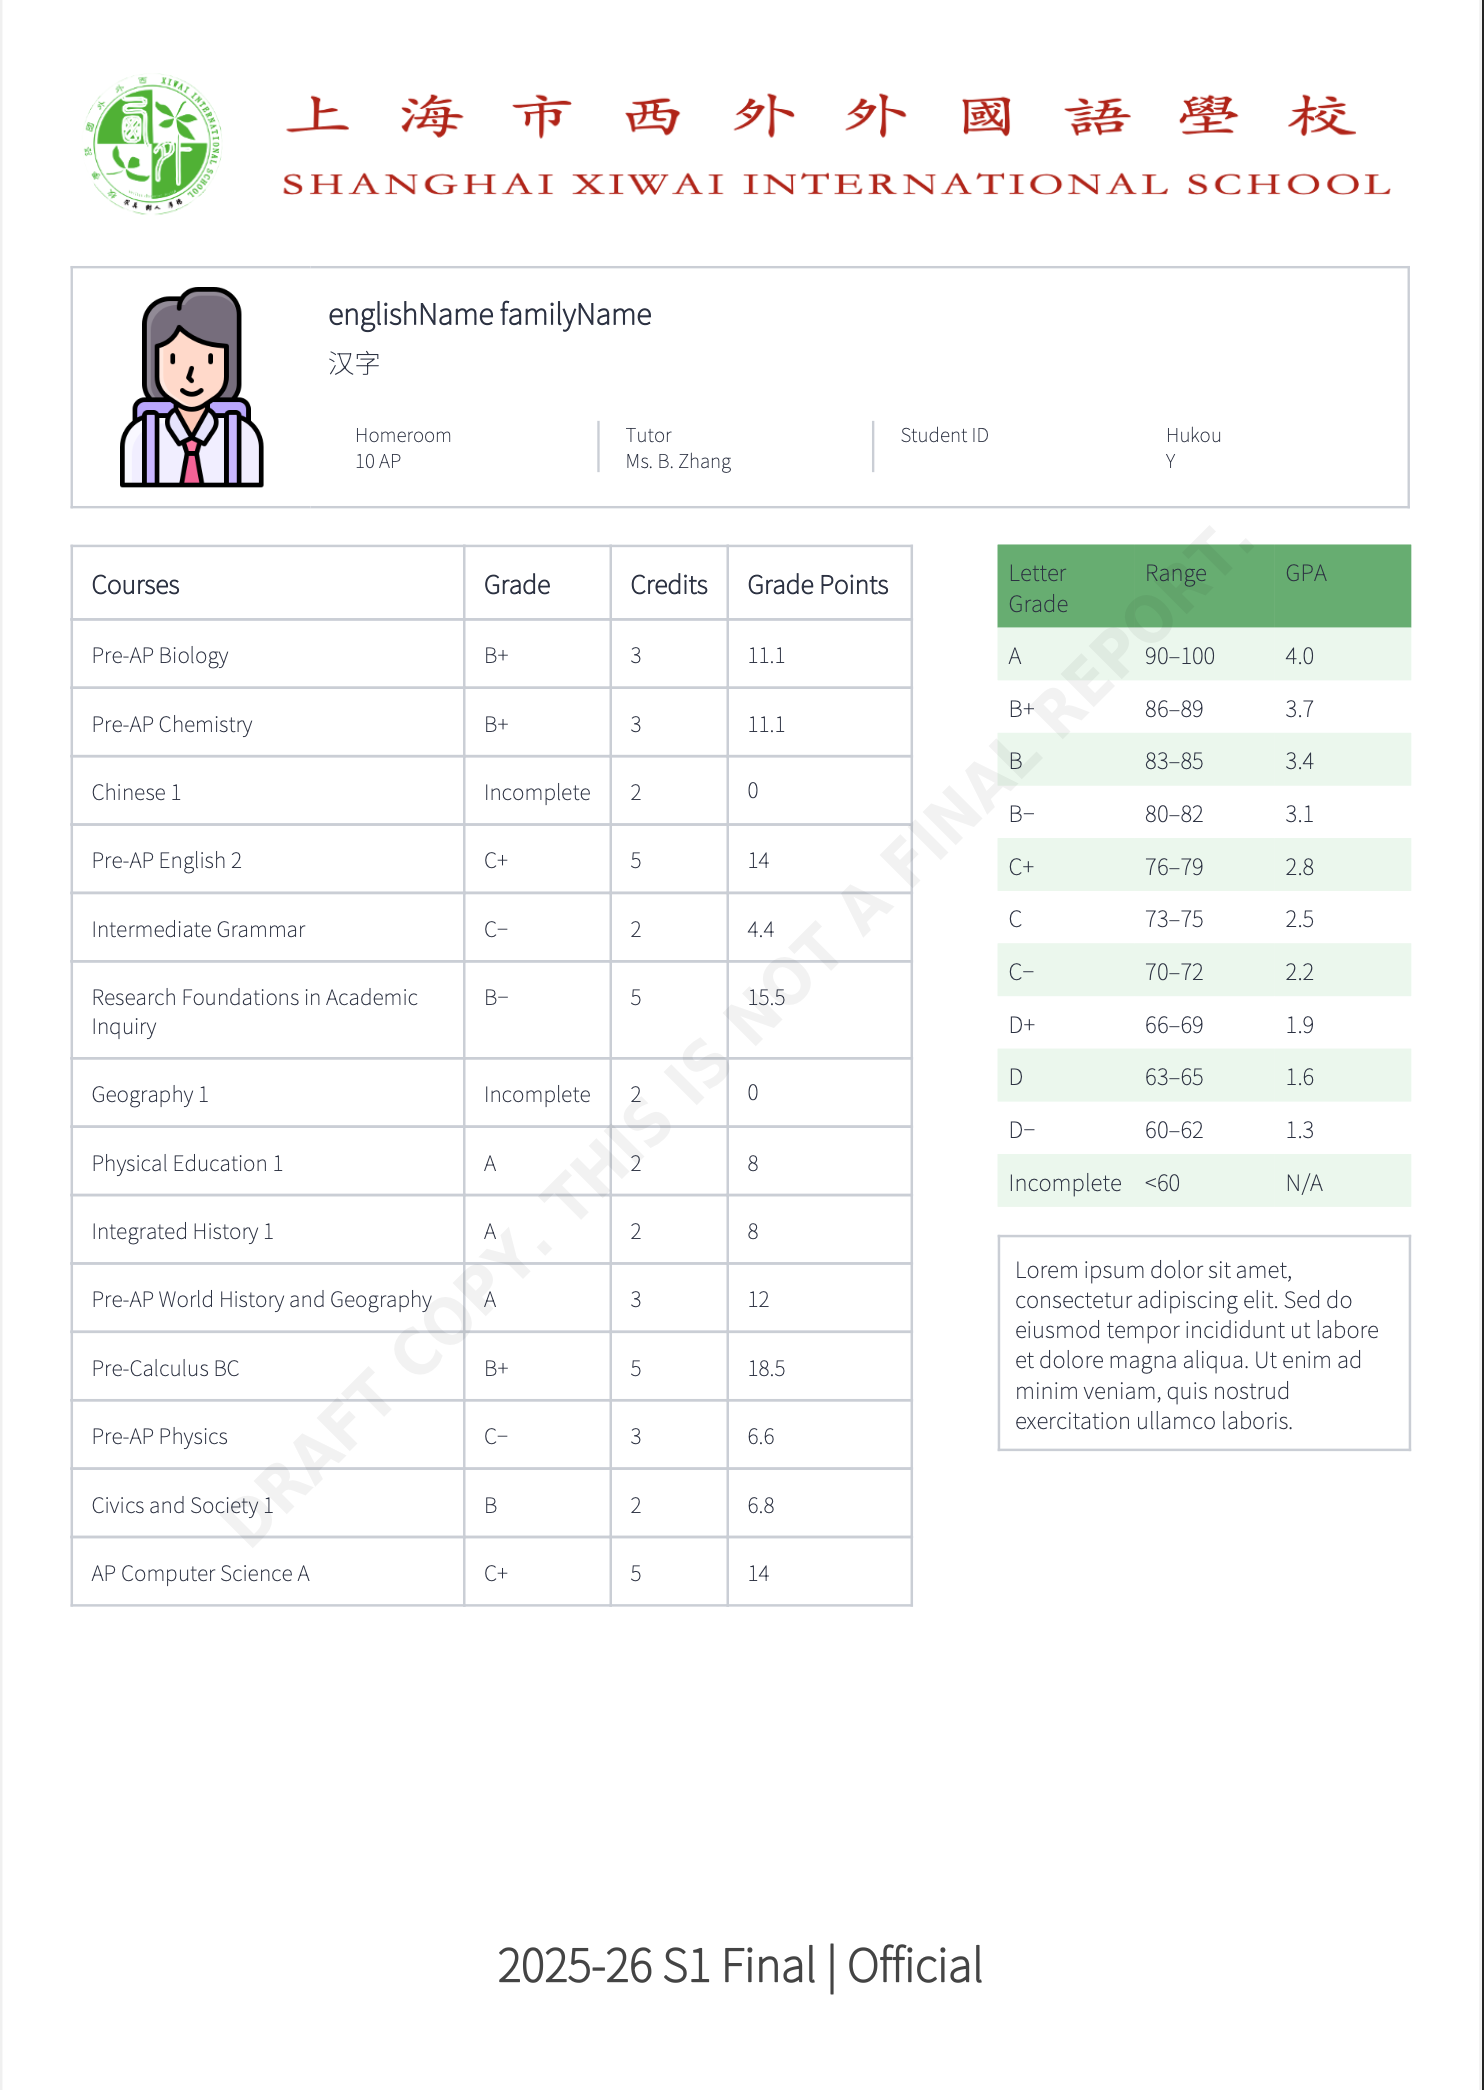
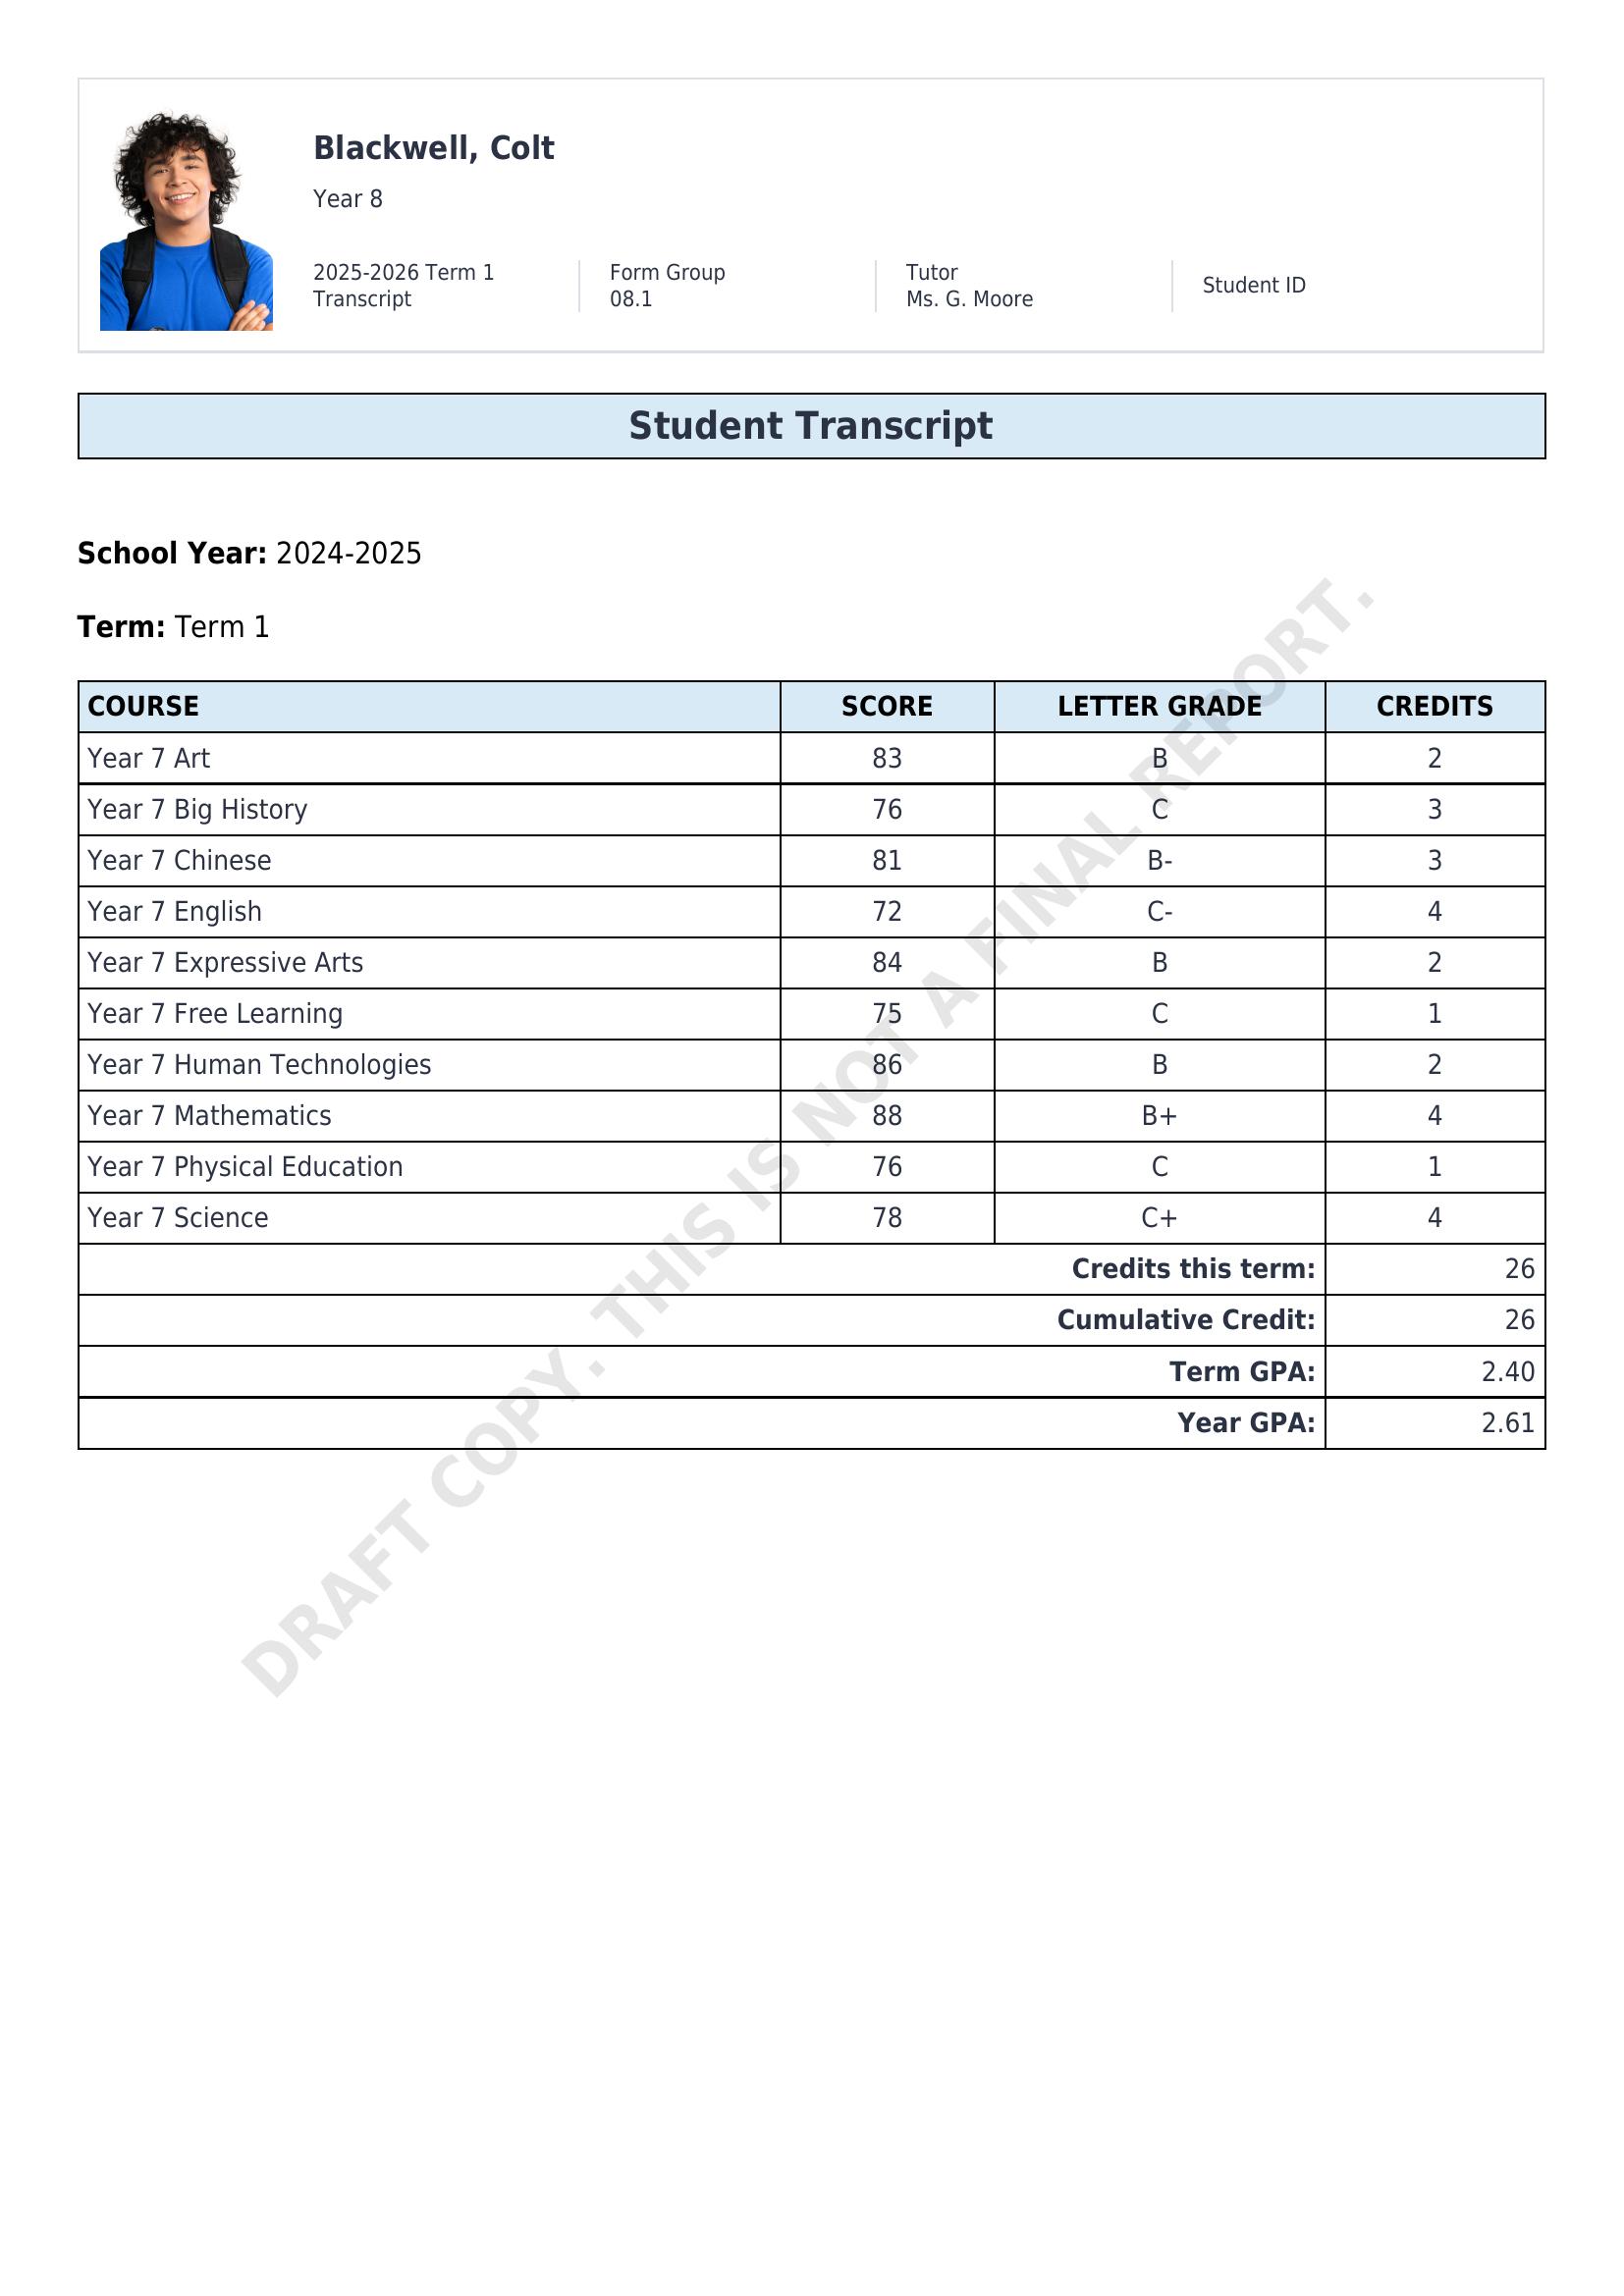
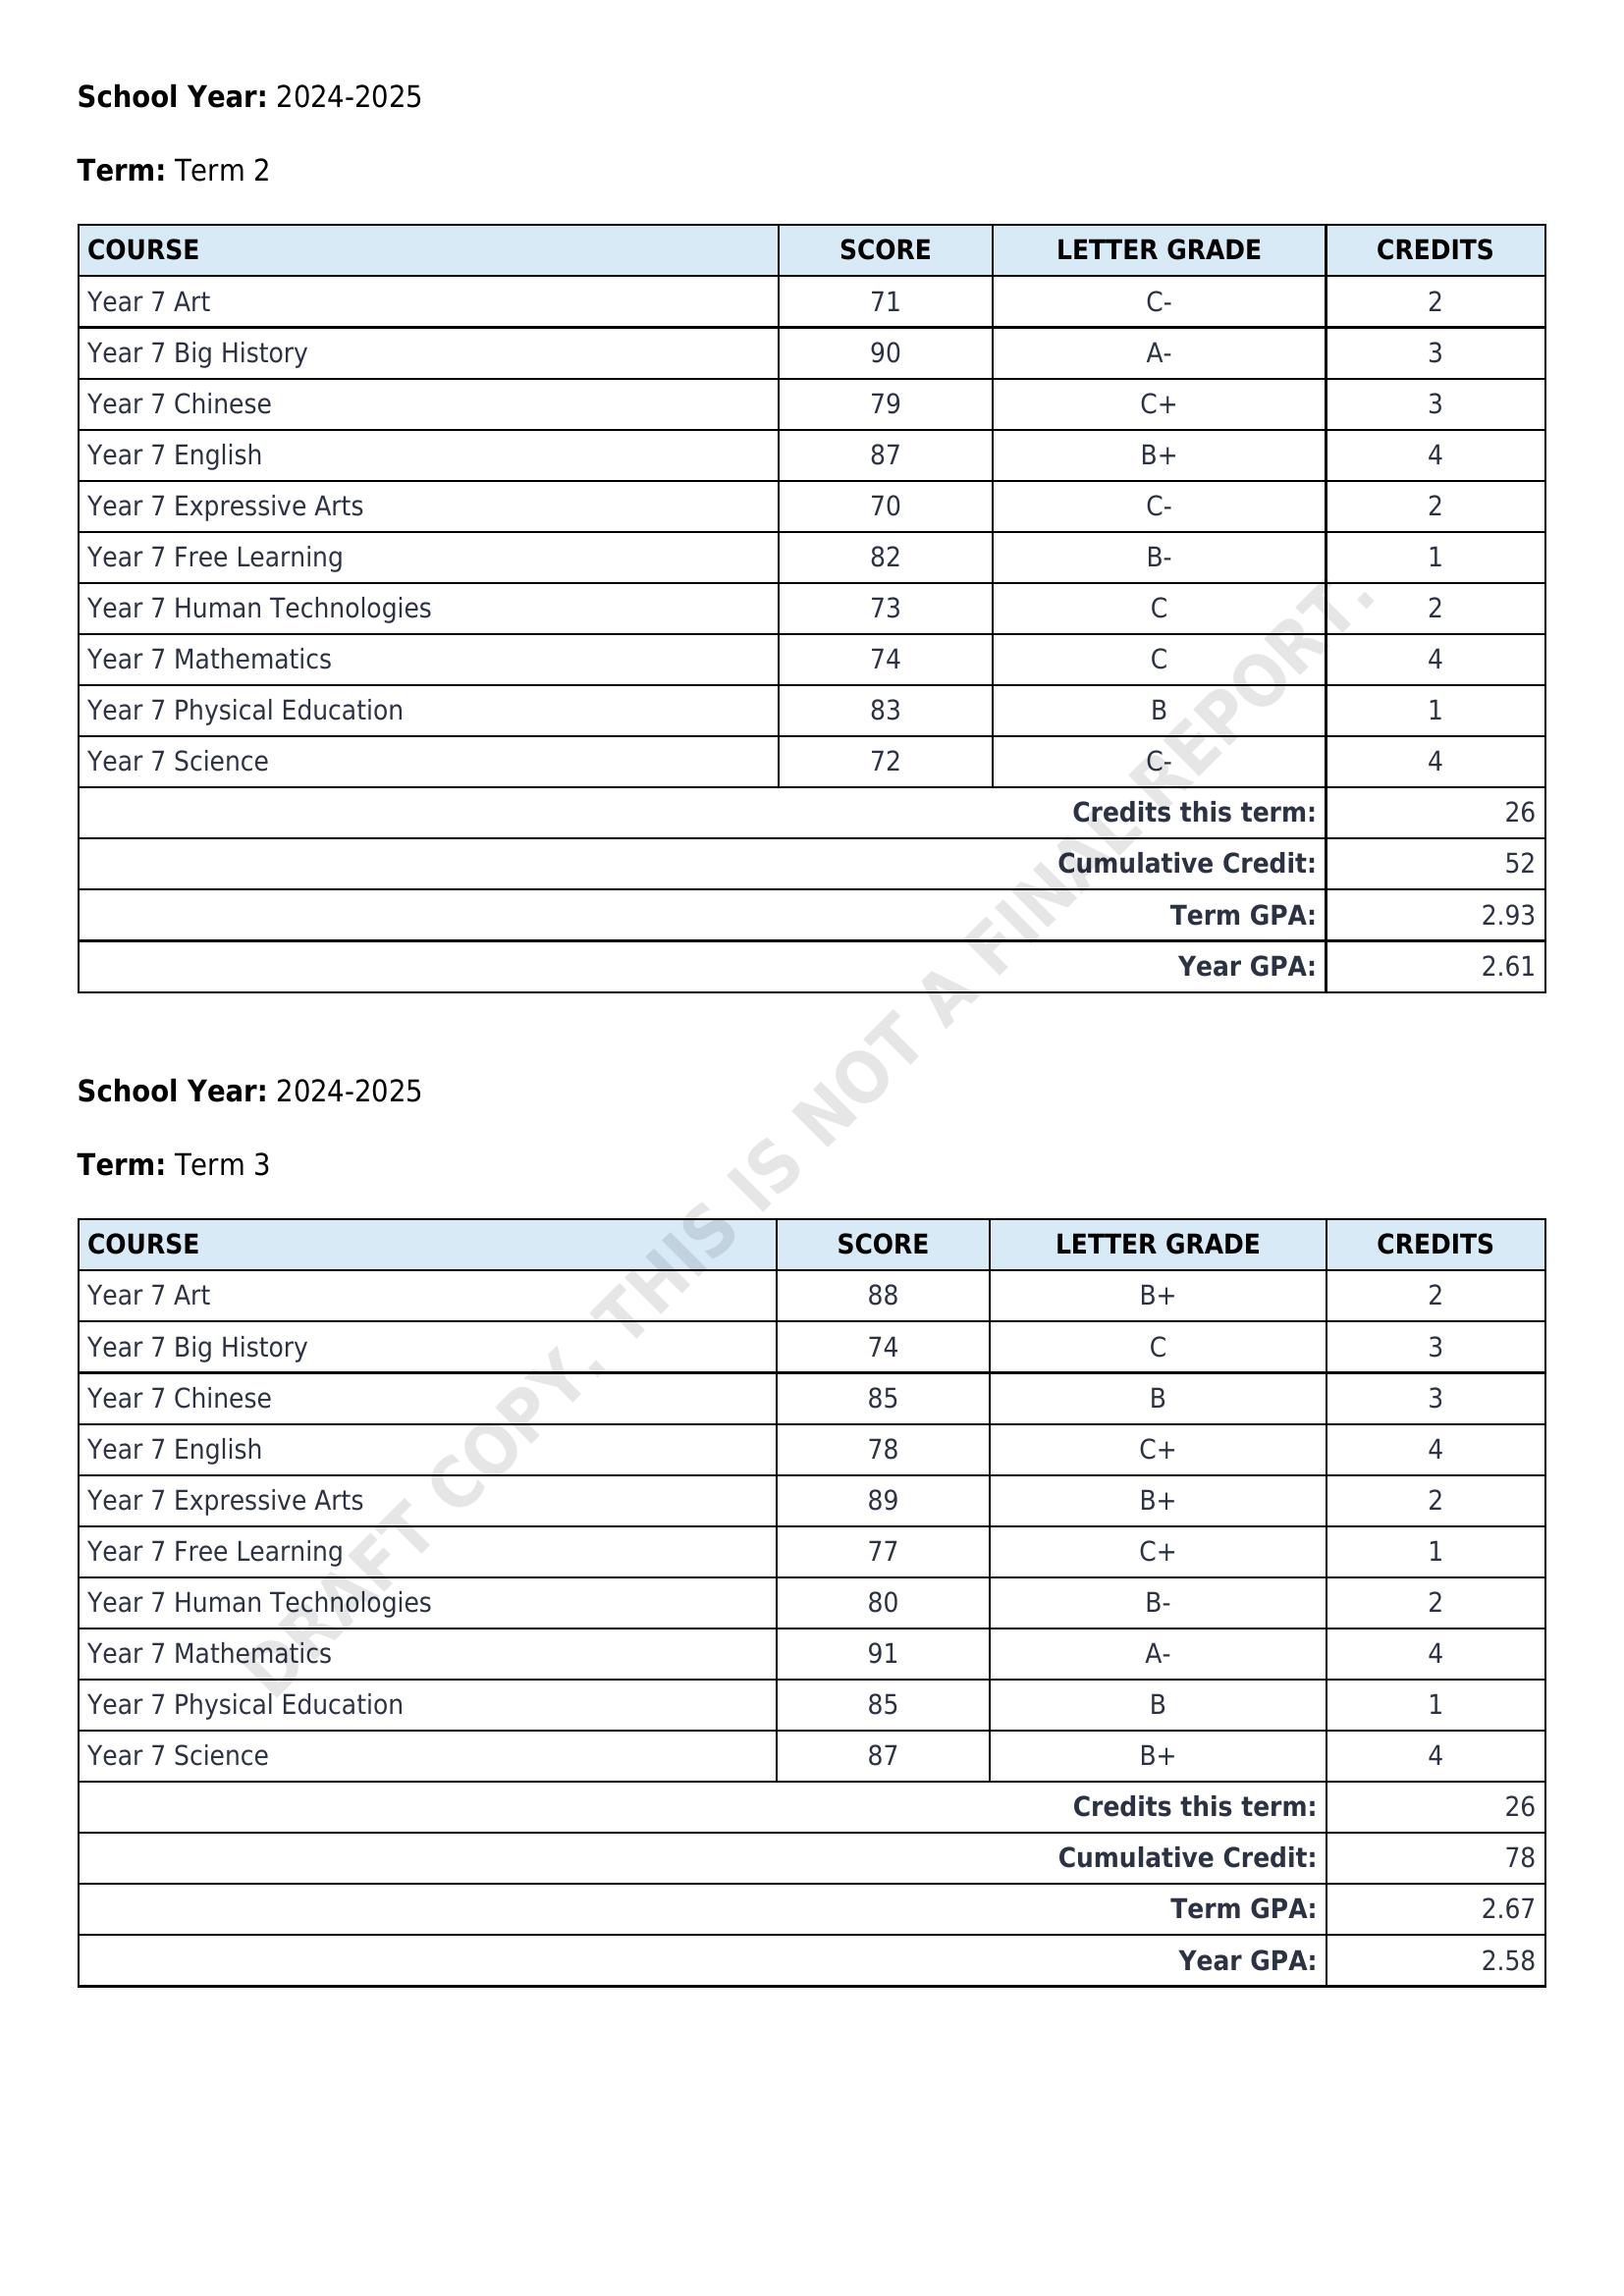
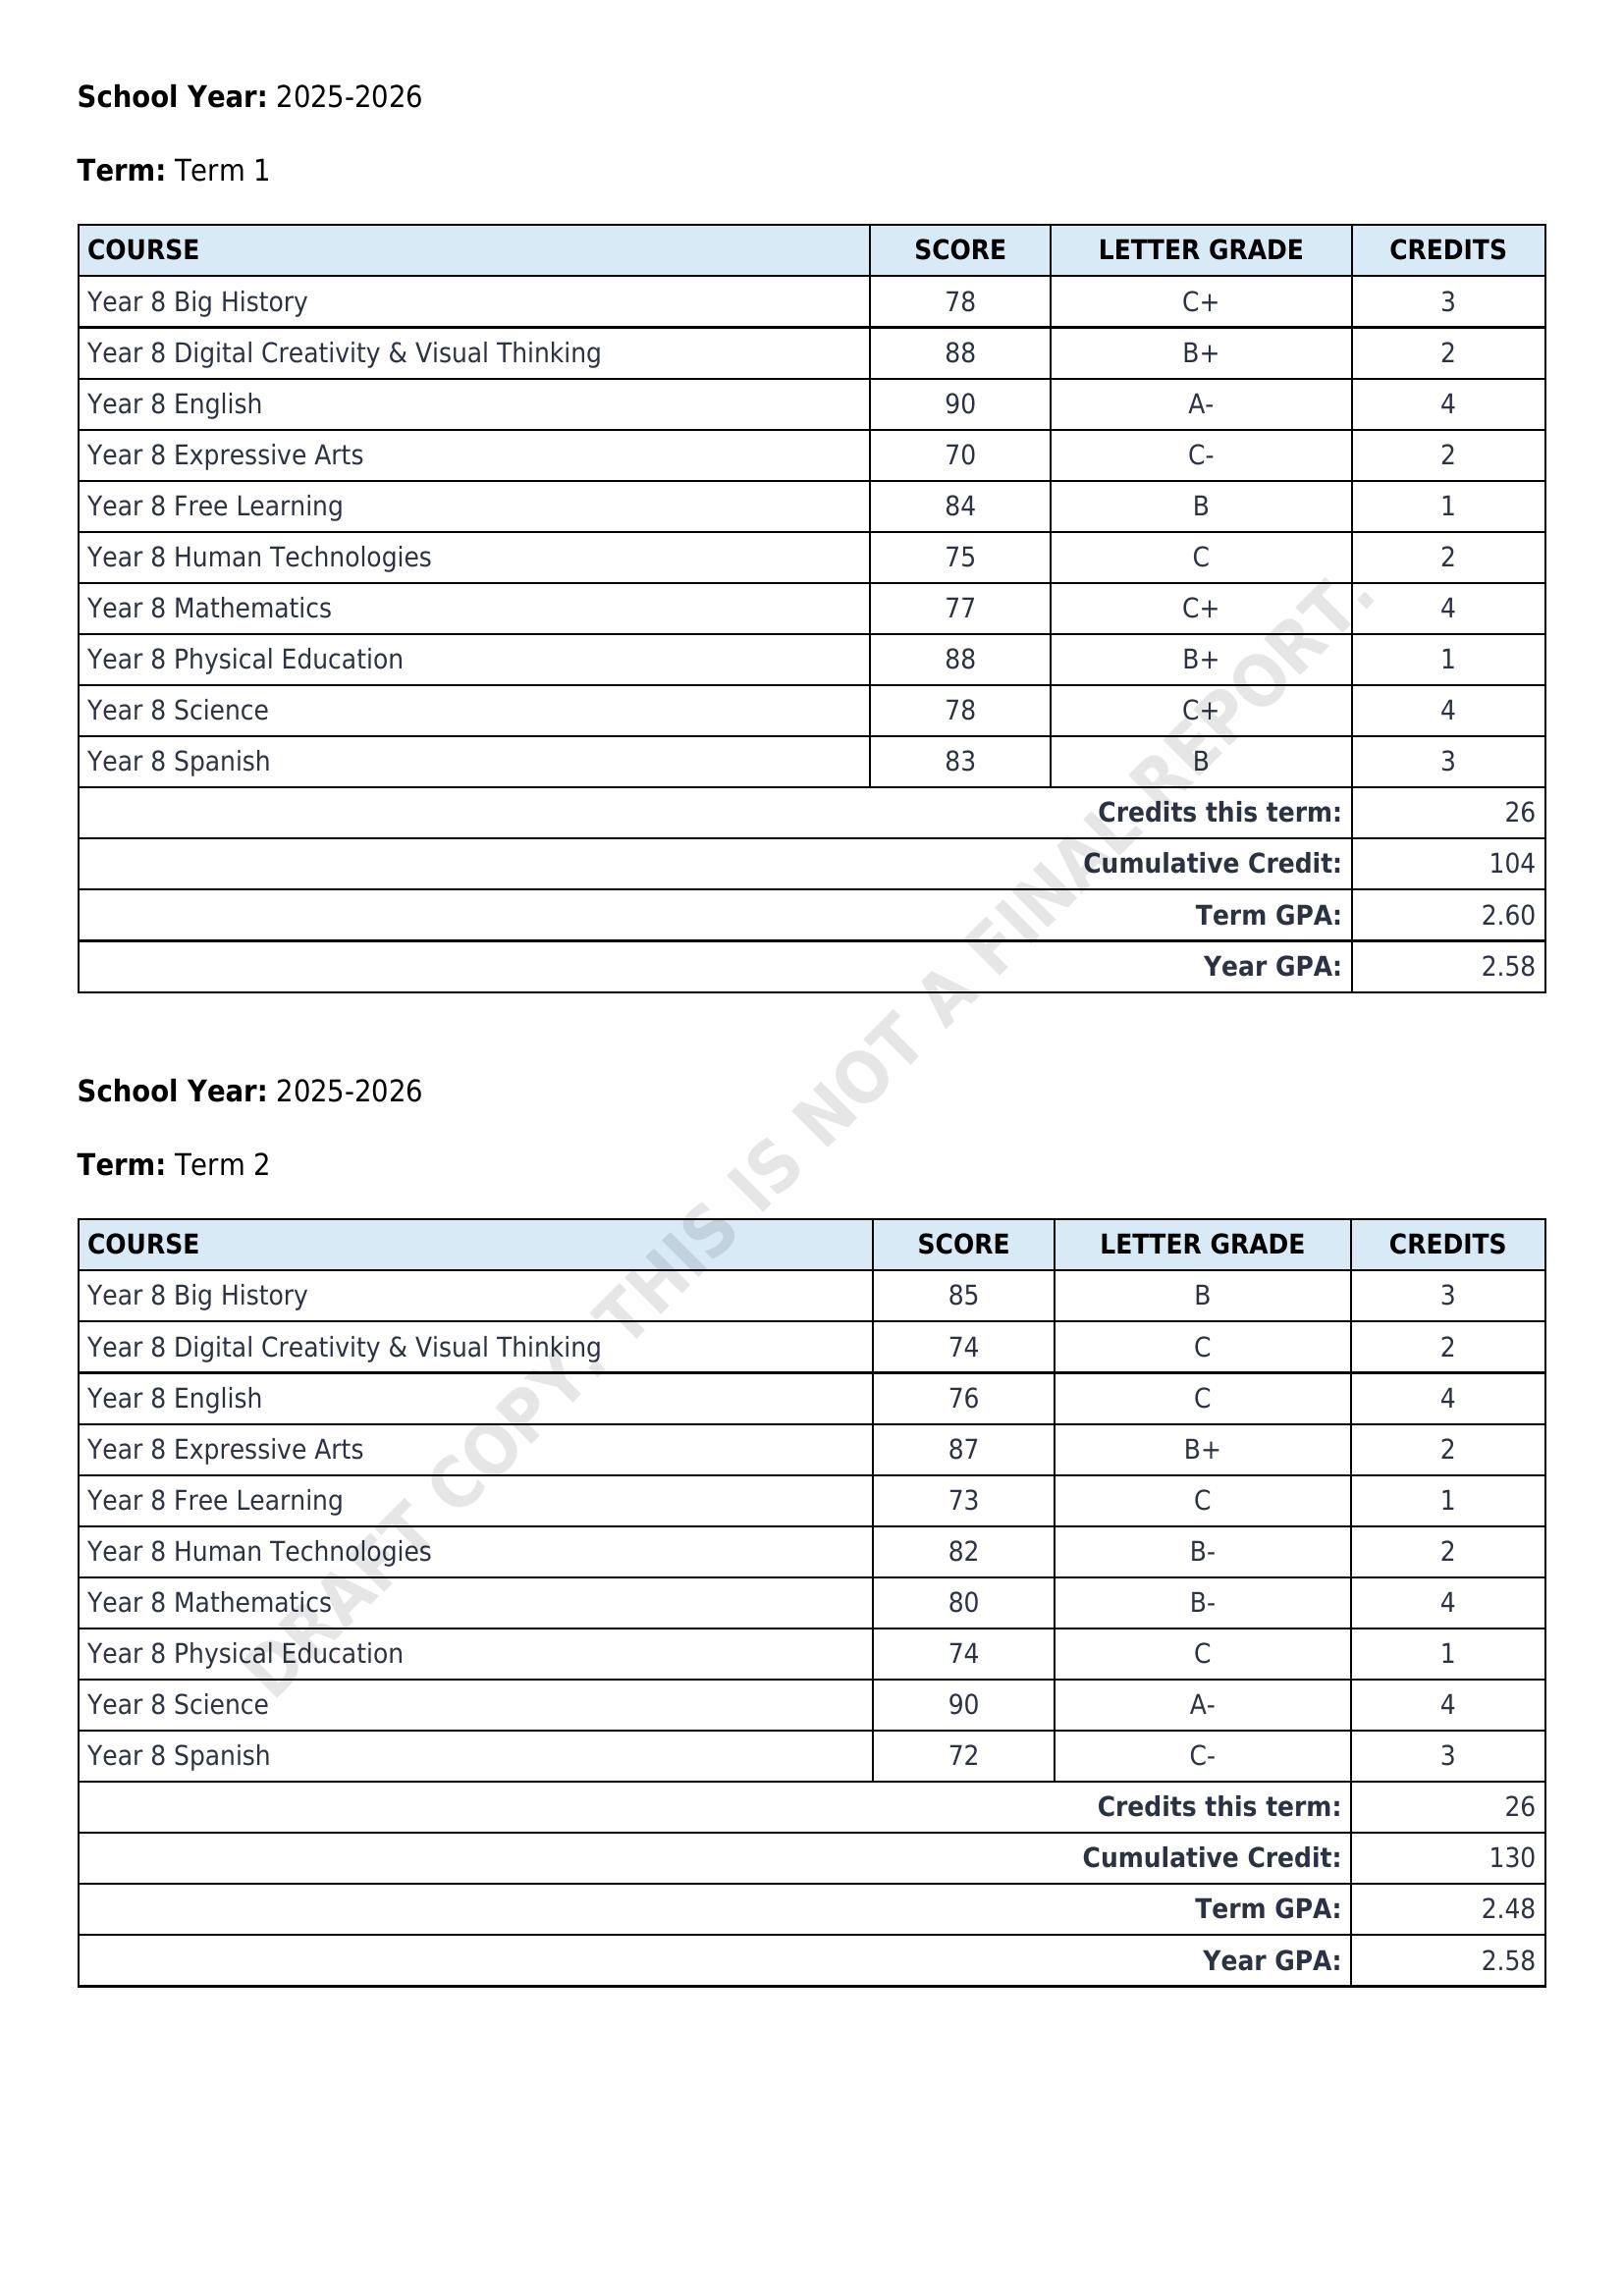
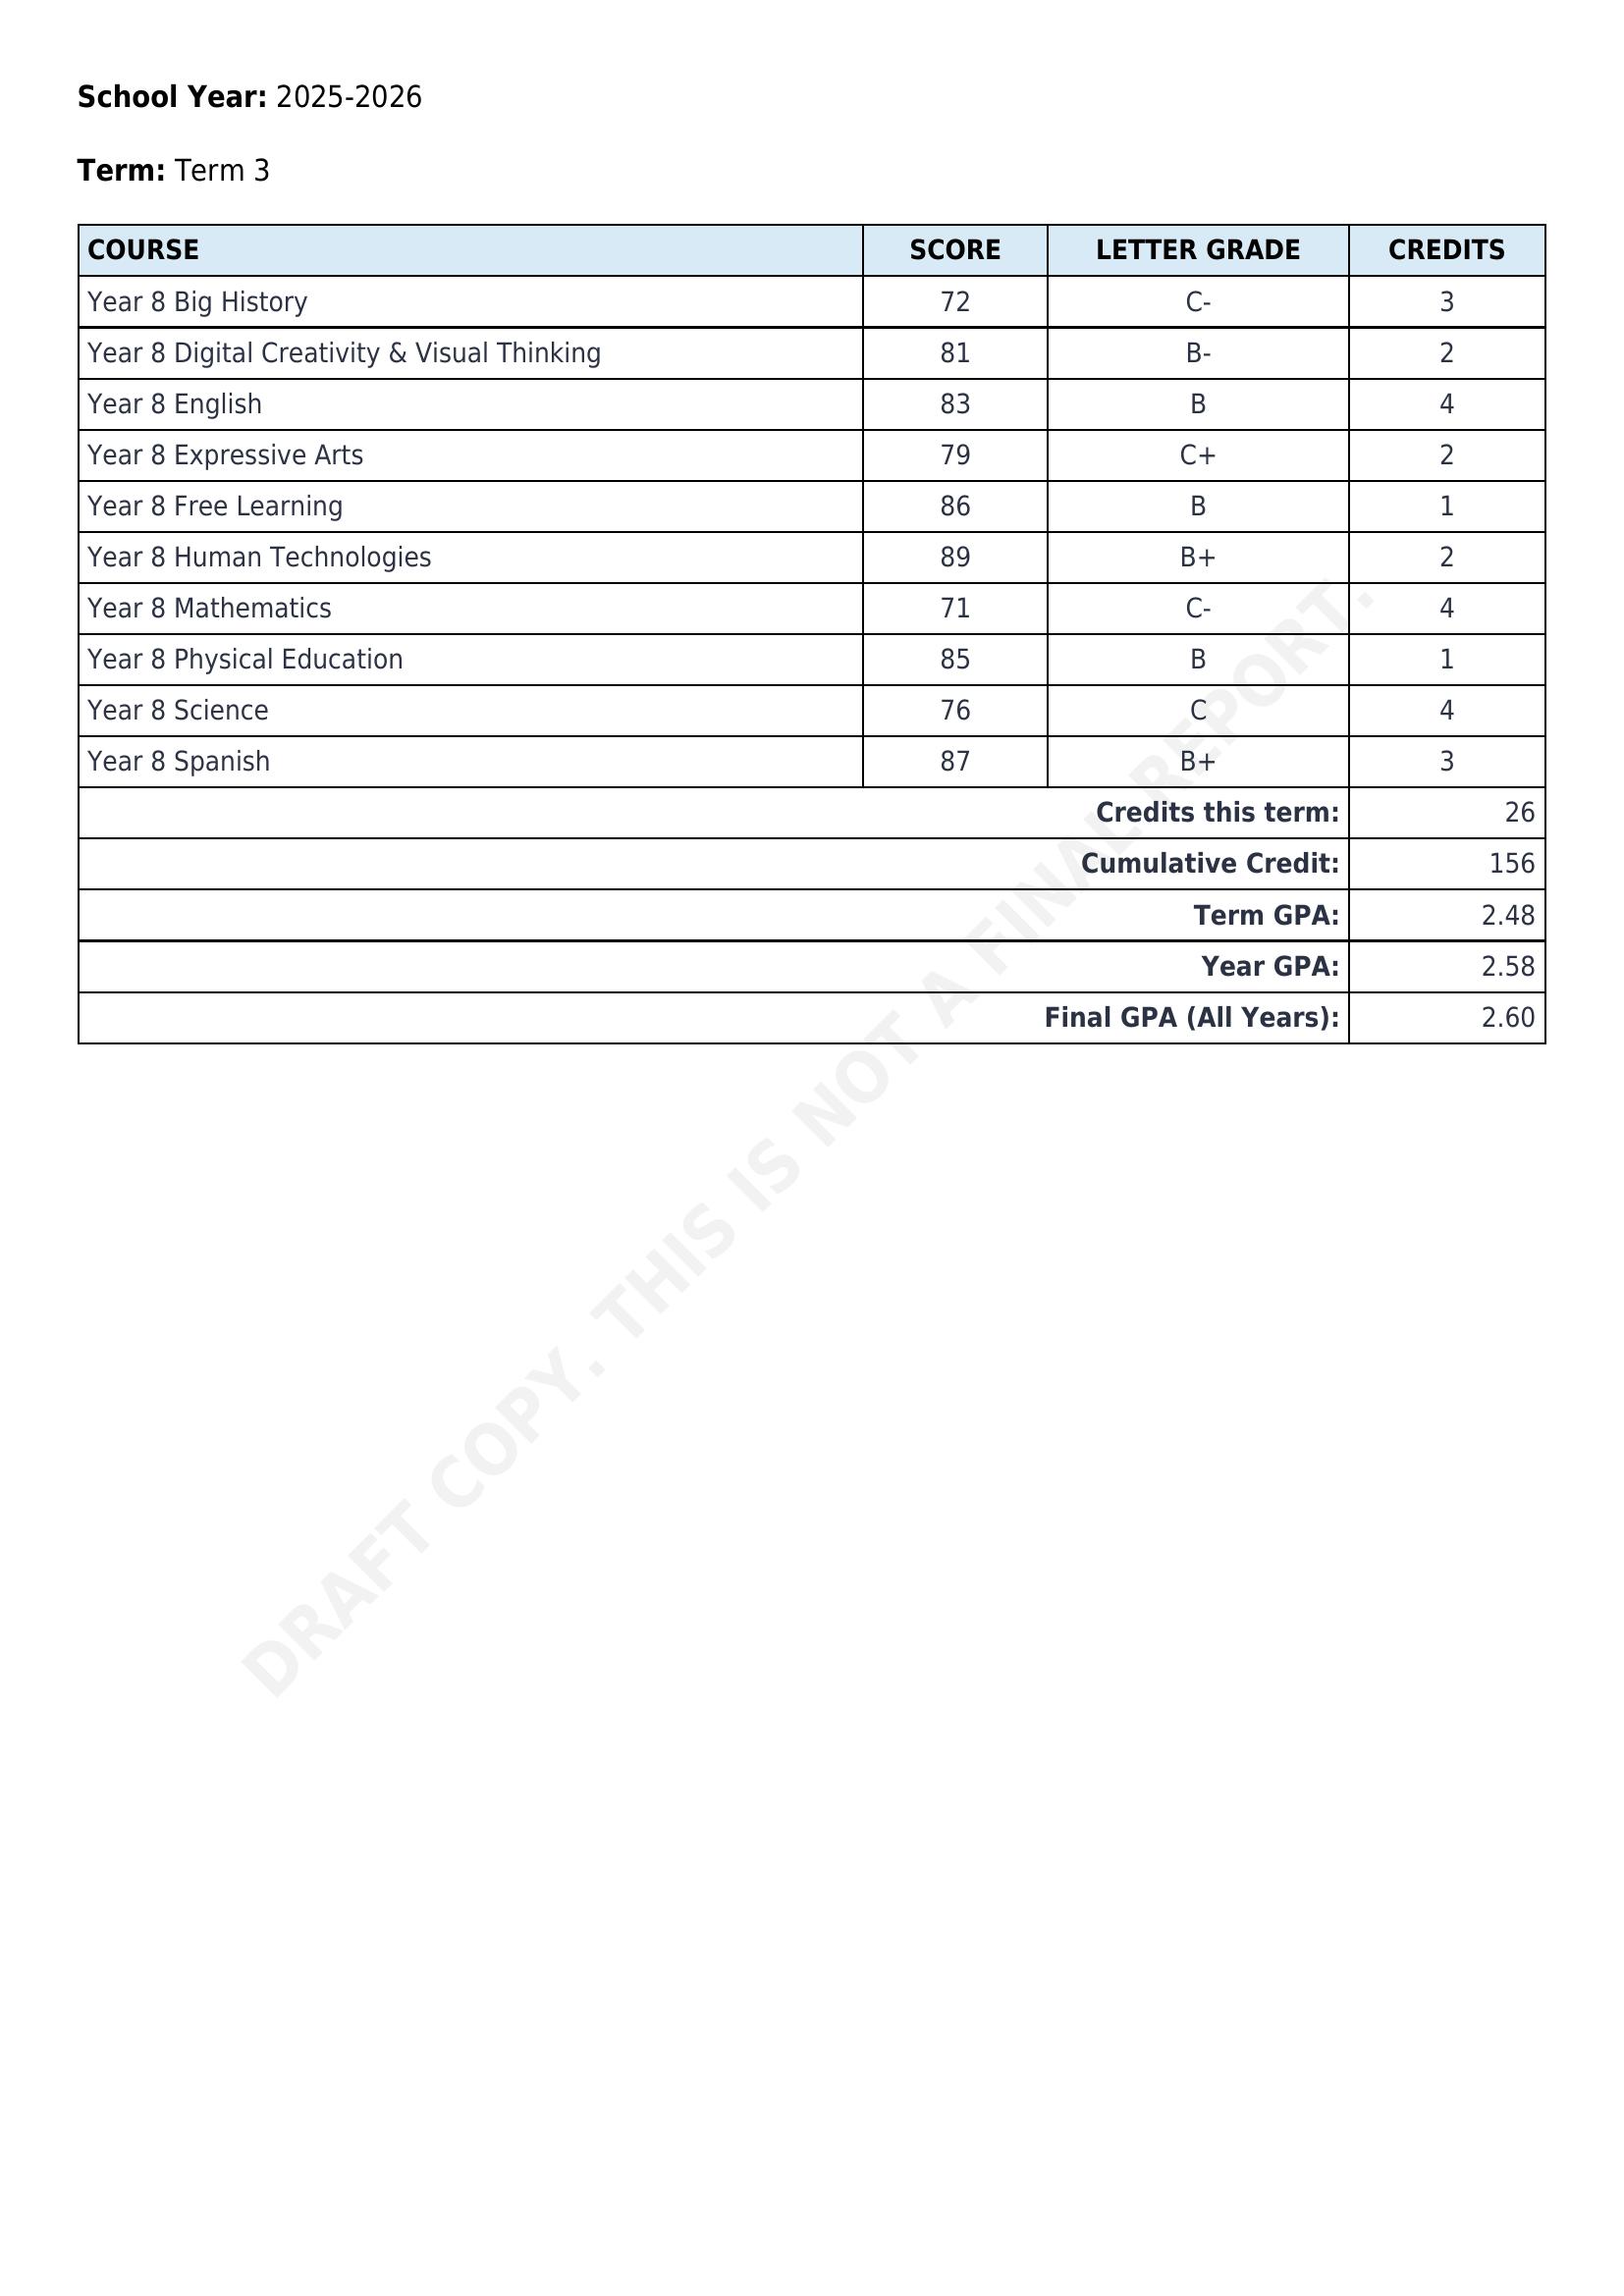
This is a work-in-progress transcript report I’m developing in Gibbon.
I’m building and testing it on a Gibbon demo site, using a student enrolled in the 2025–2026 school year.
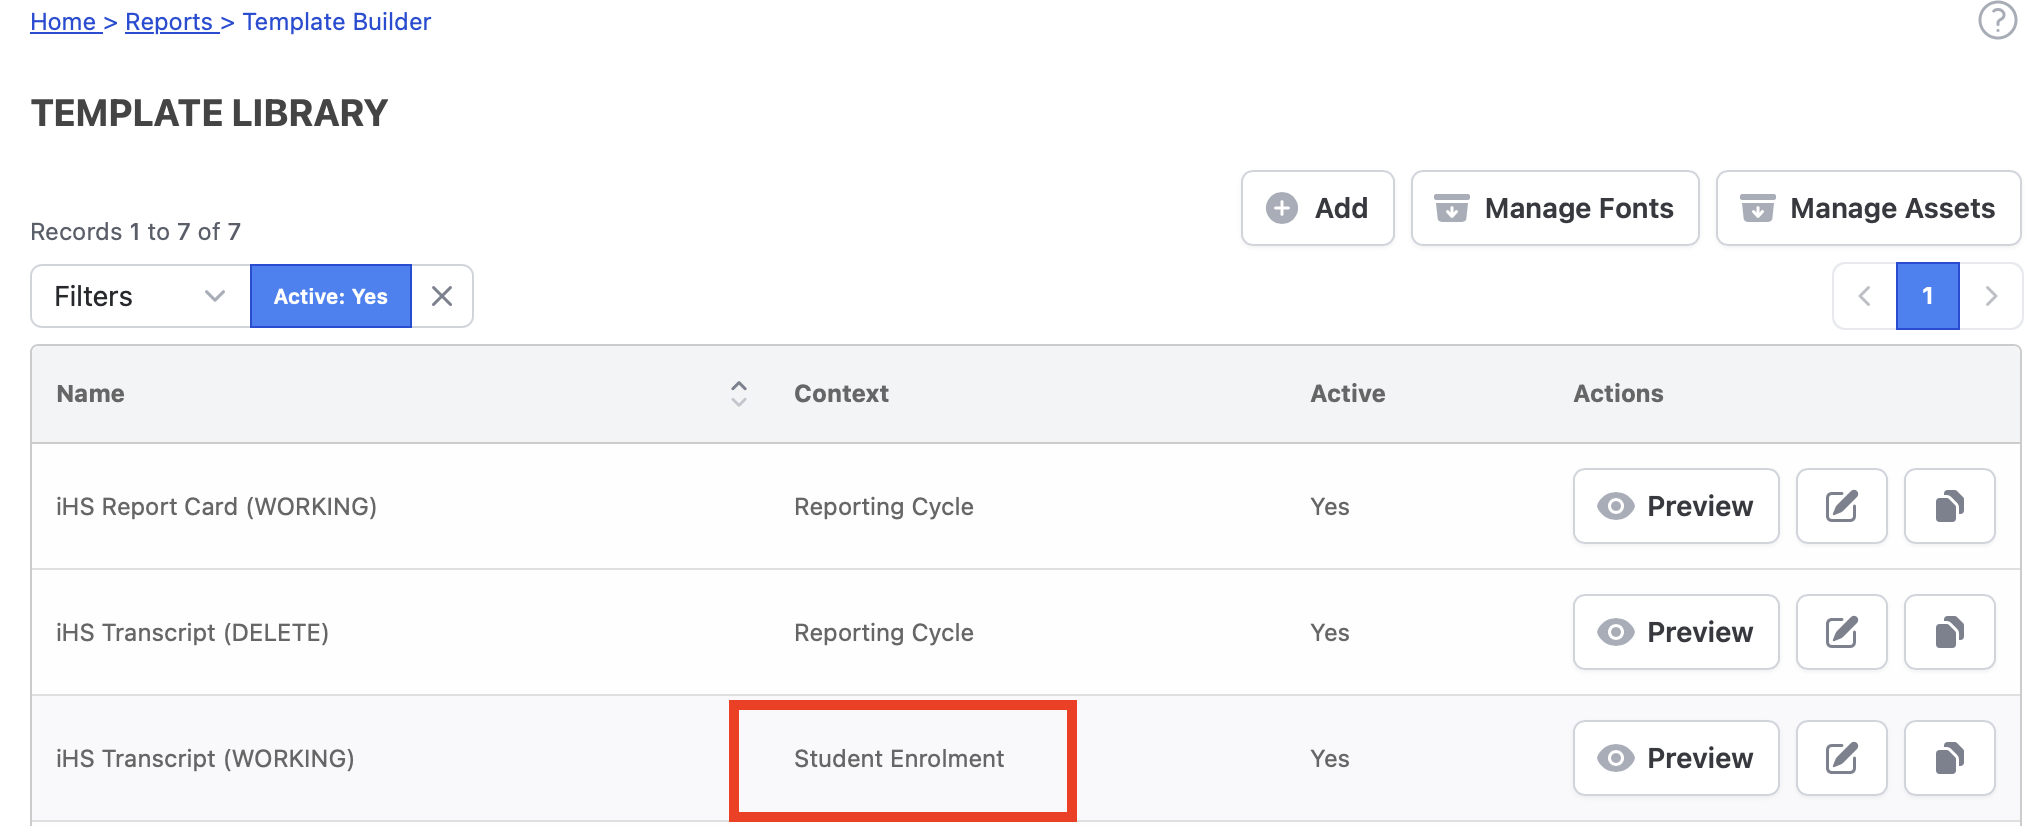
For this template, I’m not using the Reporting Cycle context; instead, I’m working directly from Student Enrolment. The data source first determines all school years in which the student has been enrolled, then iterates through each term within those years.
For each term, it checks for the presence of a Grade markbook column and retrieves the student’s entry where available.
Course credit values are stored in a custom course field and are used for term, year, and cumulative GPA calculations.
This is exactly what I’m working on (I’m using internal assessments instead of markbook, as I feel that’s more stable), but you’re several steps ahead. I’m hoping to understand what the difference between pulling from student enrolment and reporting cycles actually is, other than datasource, since it appears all reports must be tied to a school year. If it’s just a matter of datasource that’s hardly an issue since datasources can be entirely customized.
Ideally, in my environment, a transcript template is set-and-forget and not tied to school years. It’s a persistent report that could be generated across multiple years.
Yes, your report can be generated wholly within Gibbon.
In most cases like this, it’s not just a matter of sharing a file or template — it usually involves some level of custom querying and report logic, depending on how your Gibbon instance is structured.
If you’d like me to take a closer look and guide you more concretely, feel free to email me directly at [info at highpointedu.com]. From there, I can let you know what’s possible and what the next steps might look like.
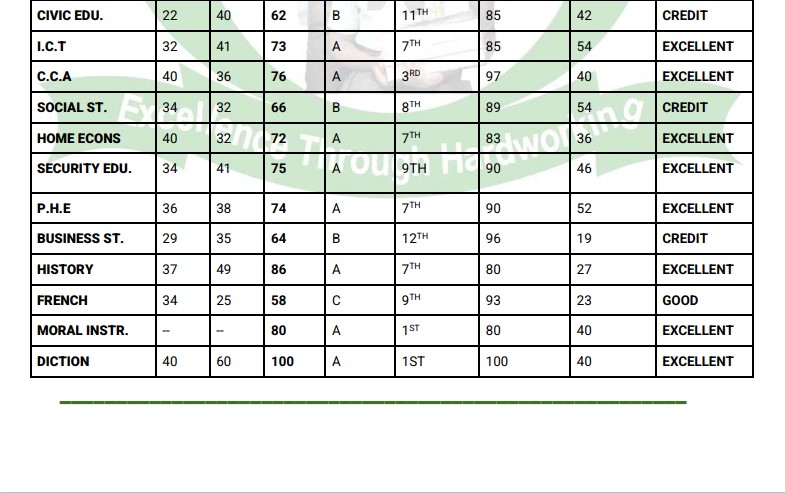
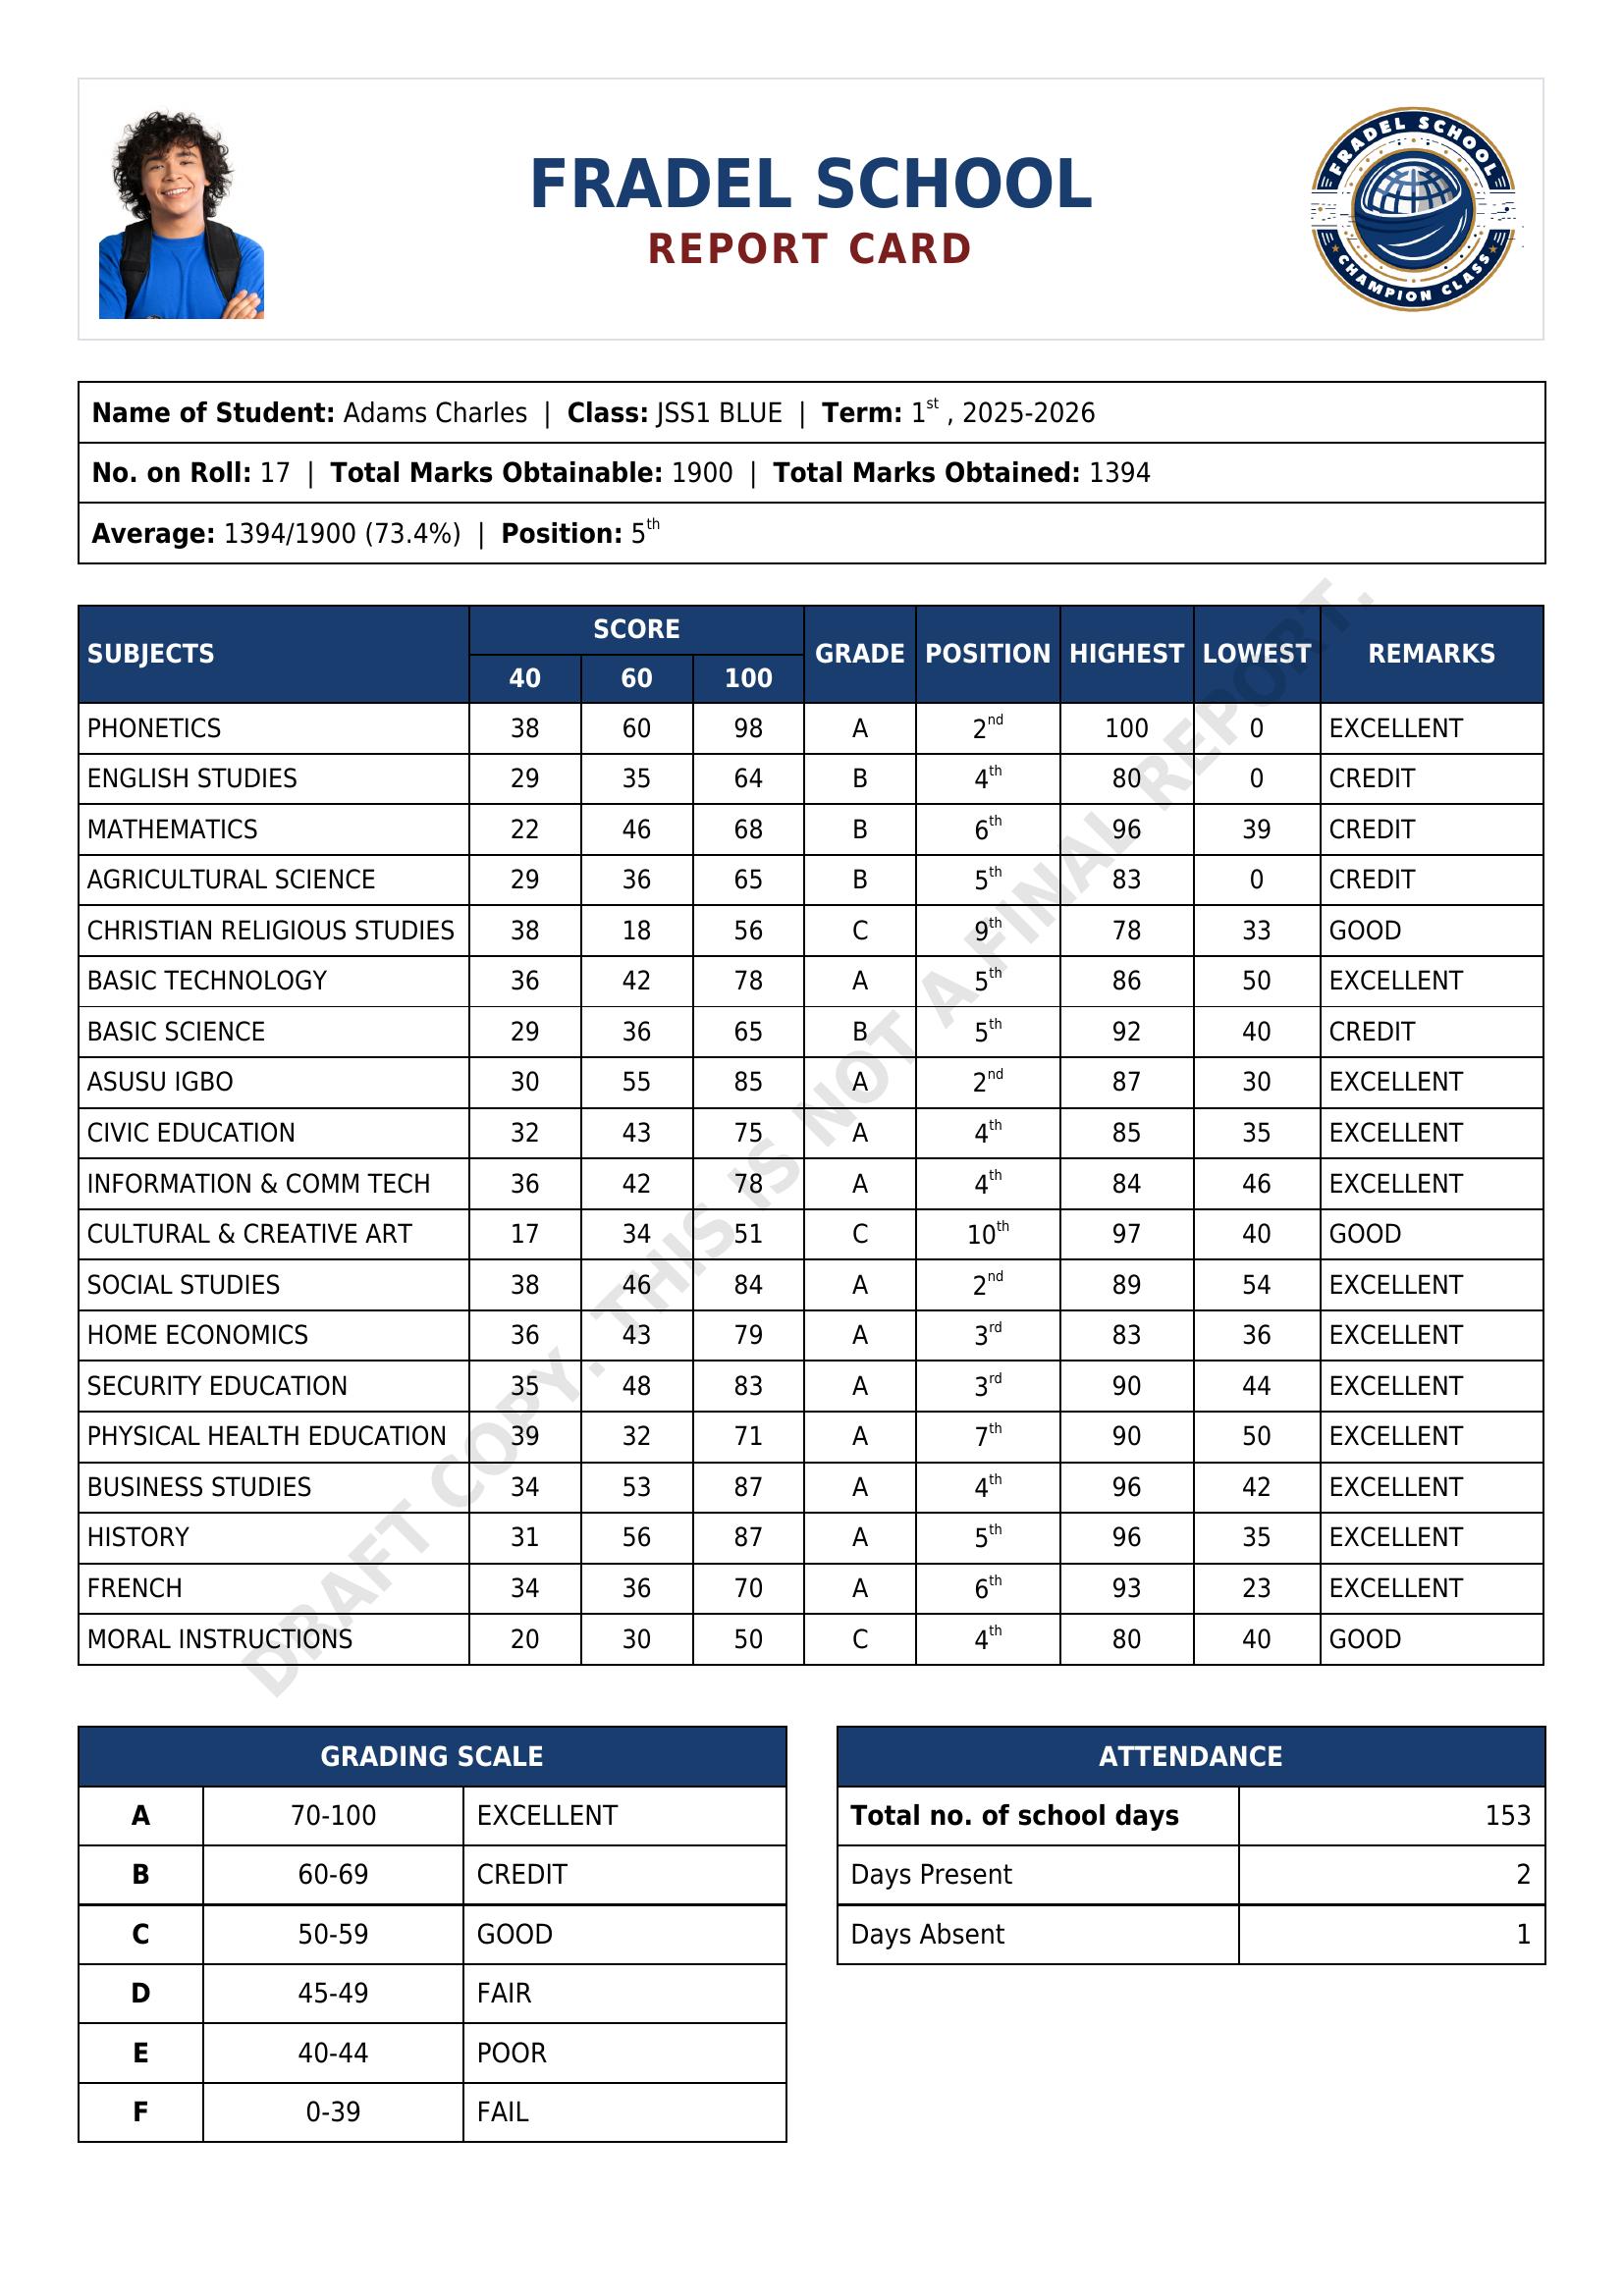
In response to a request in this thread, I built a working version of the report to demonstrate what’s possible using Gibbon’s Markbook data and Twig templates.
Subject & Form Group Analytics
For each subject, the report displays:
Highest score in the form group
Lowest score in the form group
The student’s subject position within the form group
All values are calculated dynamically from existing Markbook data.
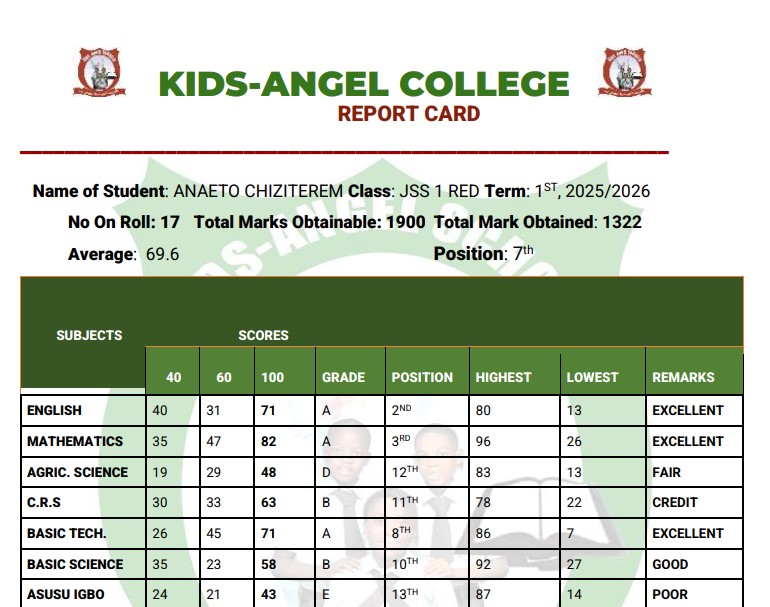
Overall Term Performance
The report also calculates and displays:
Total marks obtainable
Total marks obtained
Overall average (%)
Overall position in the form group
These figures are derived automatically from the subject-level data.
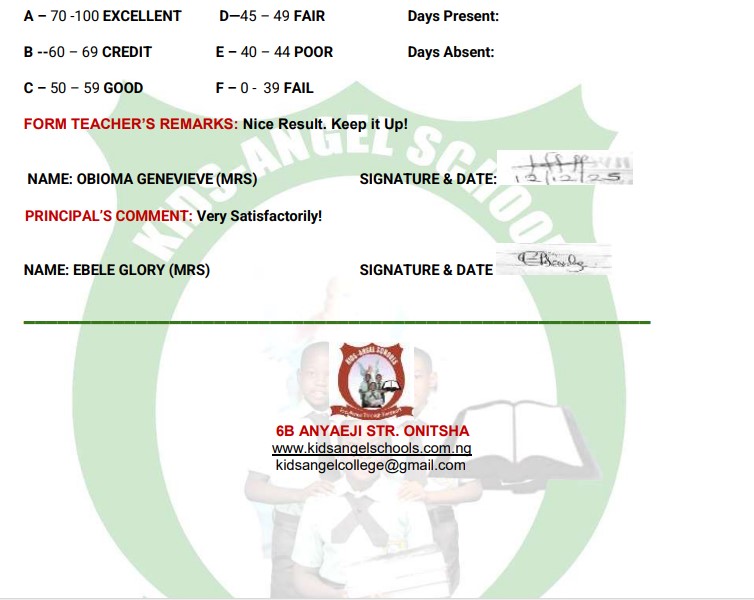
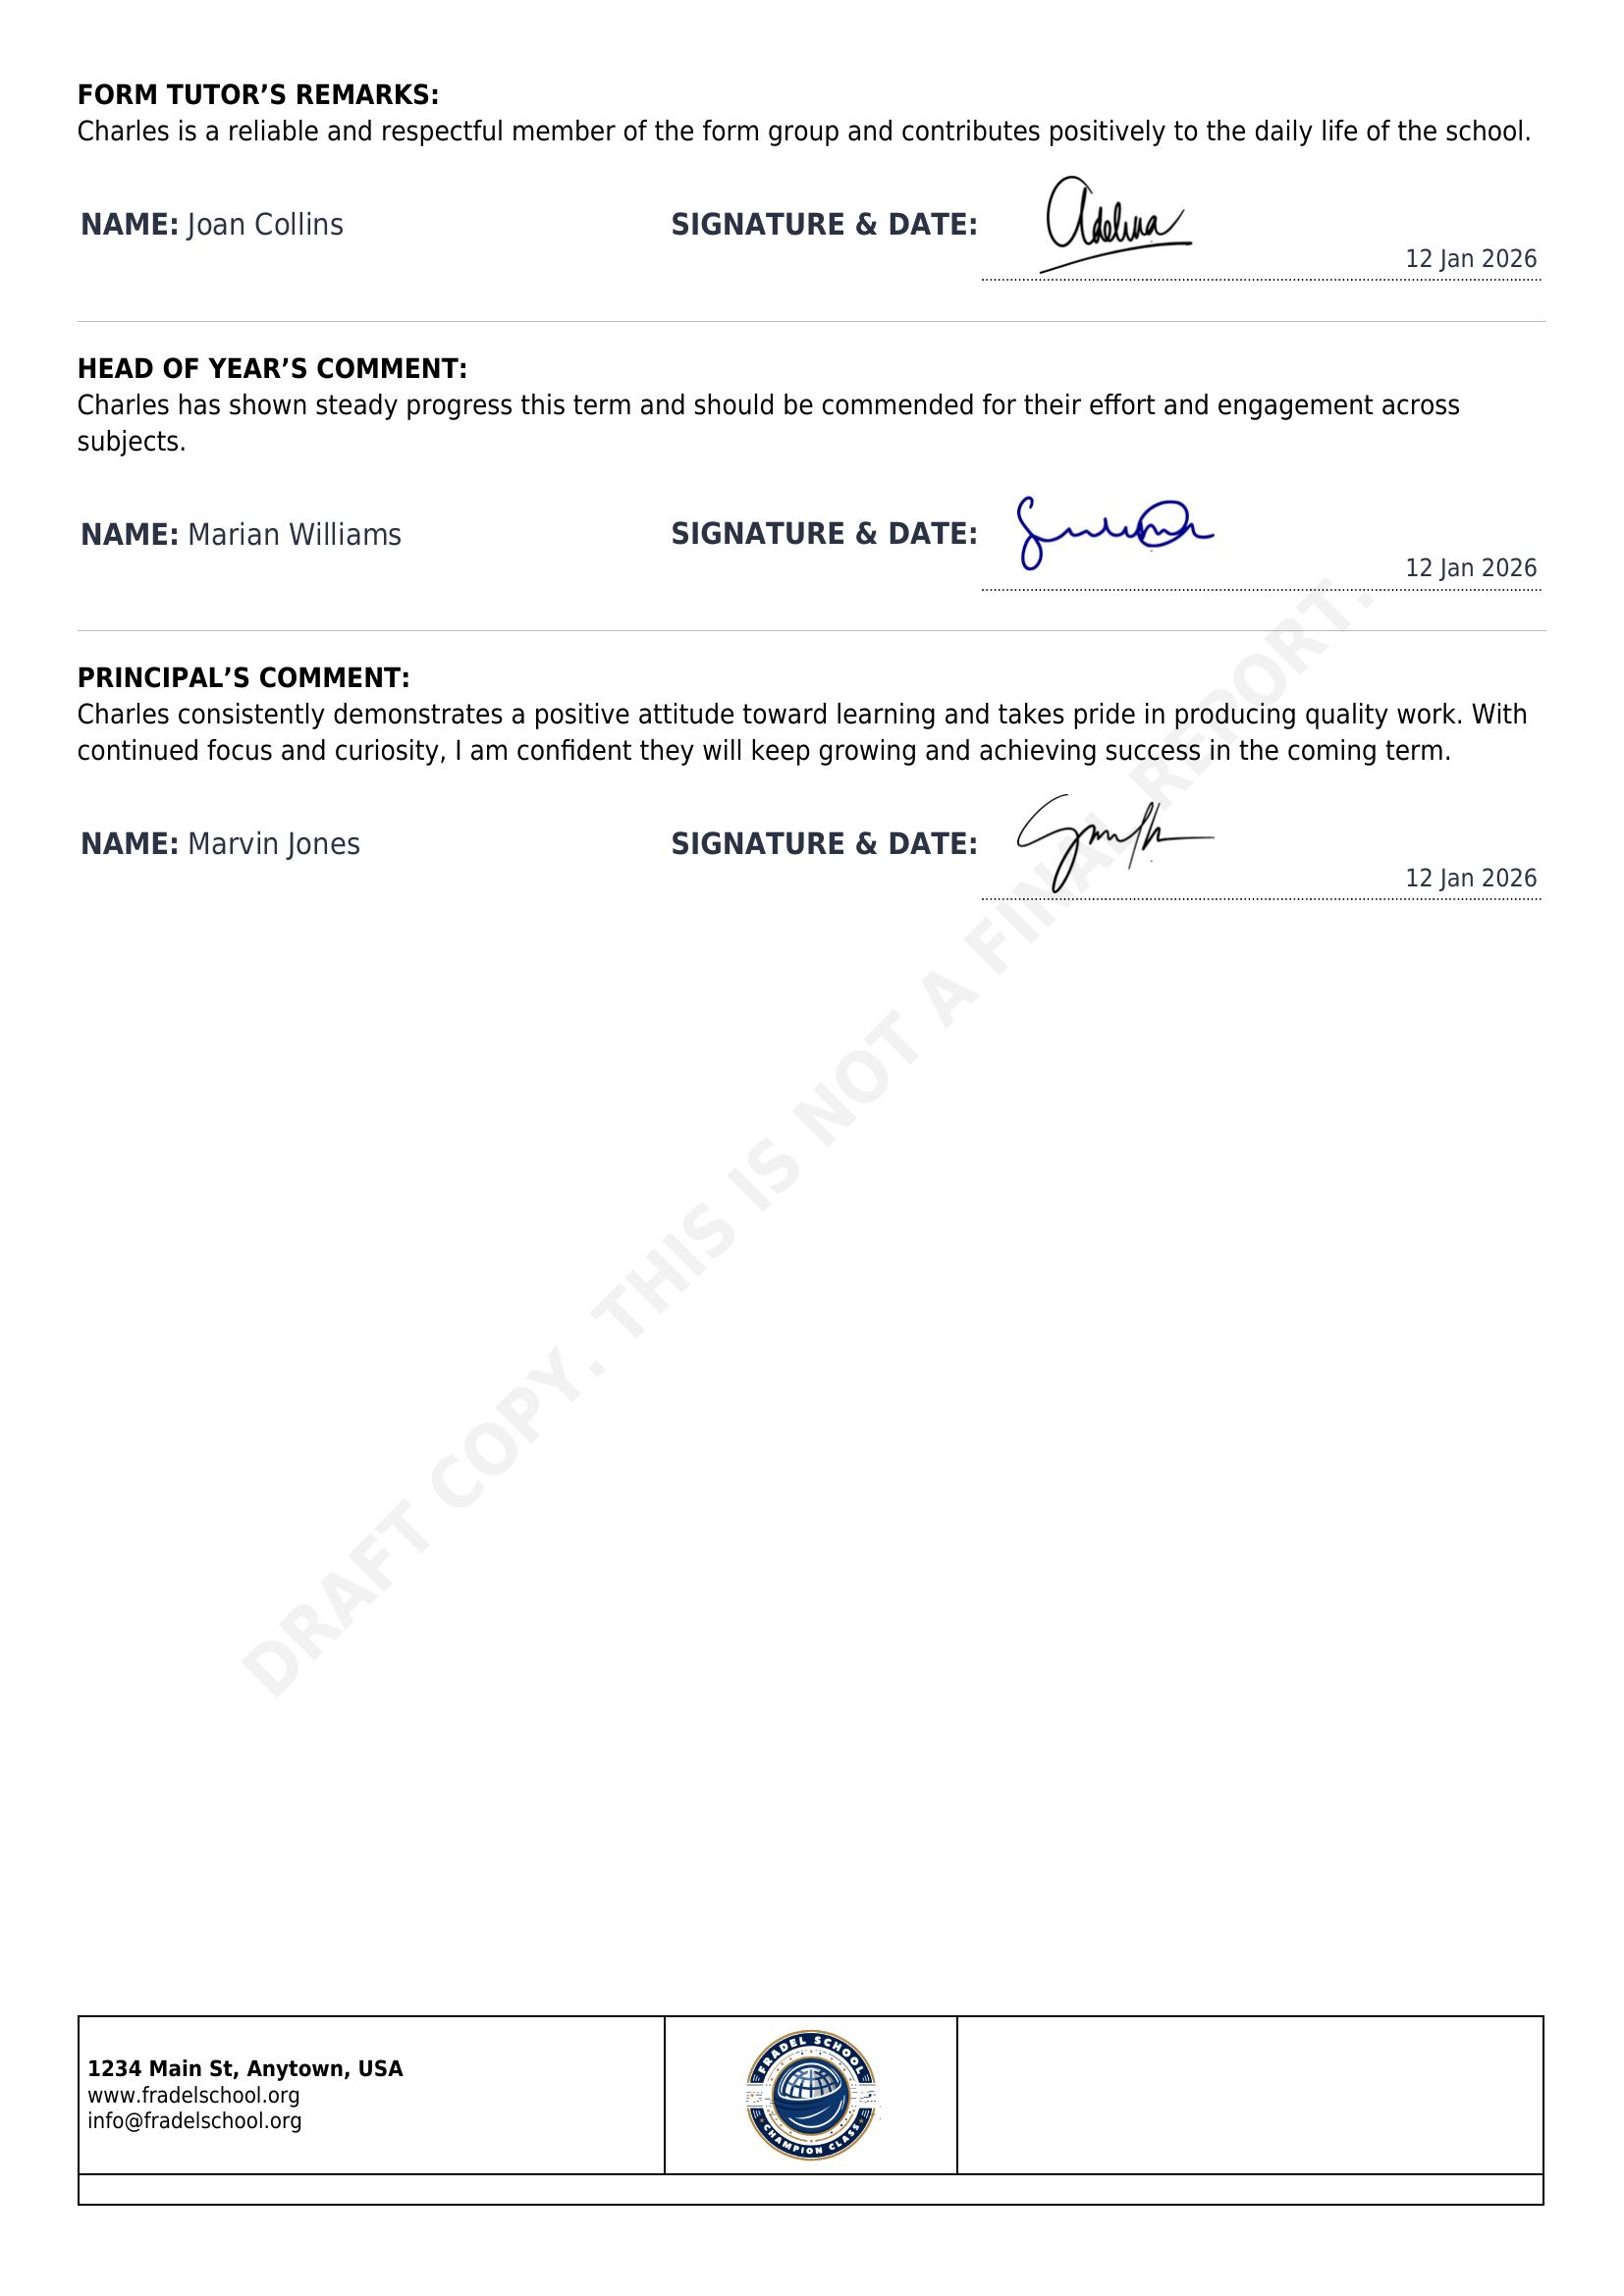
Staff Signatures via Custom Fields
All staff signatures are stored as custom staff fields, which allows for:
Reusable digital signatures
Easy updates without modifying the report template
Cleaner separation between data and presentation
Flexible Comment & Signature Blocks
Comment and signature sections are controlled using simple Twig toggles, making it easy to show or hide:
Form Tutor
Head of Year
Principal
(and any future roles if needed)
This keeps the template flexible across different school workflows.
Principal Lookup by Job Title
The Principal is resolved dynamically using gibbonStaff.jobTitle (e.g. Principal, School Director), rather than hard-coding a specific person ID.
This makes the report more future-proof and easier to maintain if staff change.
I’ve been experimenting further with the Reports module, especially alongside the Markbook and Attendance modules.
This sample report combines several features schools commonly request — including grades, attendance summaries, comments, charts, student photos, positioning, and overall progress tracking.
With many schools approaching final reporting season, I thought I’d share this for anyone looking to refresh or modernize their report cards in Gibbon.
Happy to exchange ideas or share examples with anyone exploring more advanced reporting layouts.